Watch your governed agents.
Cendor Monitor — the optional, self-hosted journey view — renders the standard OpenTelemetry your Cendor libraries and SDK already emit as the whole story of every governed run: agents → sessions → runs, the full journey (prompts, responses, thinking, tokens, cost — content opt-in) with governance verdicts inline. It has two doors, one per way of using Cendor — Libraries and SDK, each its own store, never mixed. It runs where your agents run; nothing leaves your infrastructure. This is dev tooling, like cendor-mcp — never "the product".
One wire, two ways to watch it. Cendor emits standard OpenTelemetry — one wire, no Cendor-specific exporter, never a Cendor endpoint. Where it goes is your choice: your own backend (Azure Monitor, CloudWatch, Datadog, Langfuse, any OTLP) for production fleets — or Cendor Monitor, the free, open-source, self-hosted journey view, when you want to see your governed agents in one screen: every prompt, token, dollar, and the exact step where a budget or guardrail acted. Same wire either way; switch or run both without touching code.
The monitor, screen by screen
Real screenshots of the shipped console — captured on v0.14.2 — rendering one real governed run: a keyless, reproducible refunds-triage workload (a stubbed model, one cassette-replayed call), with content capture opted in for it. The monitor ships no sample app and seeds nothing: every screen here is fed by an actual run, so the numbers are that run's. The tag you run below is 0.15.0, which changed the ingest service and the docs — not these screens.
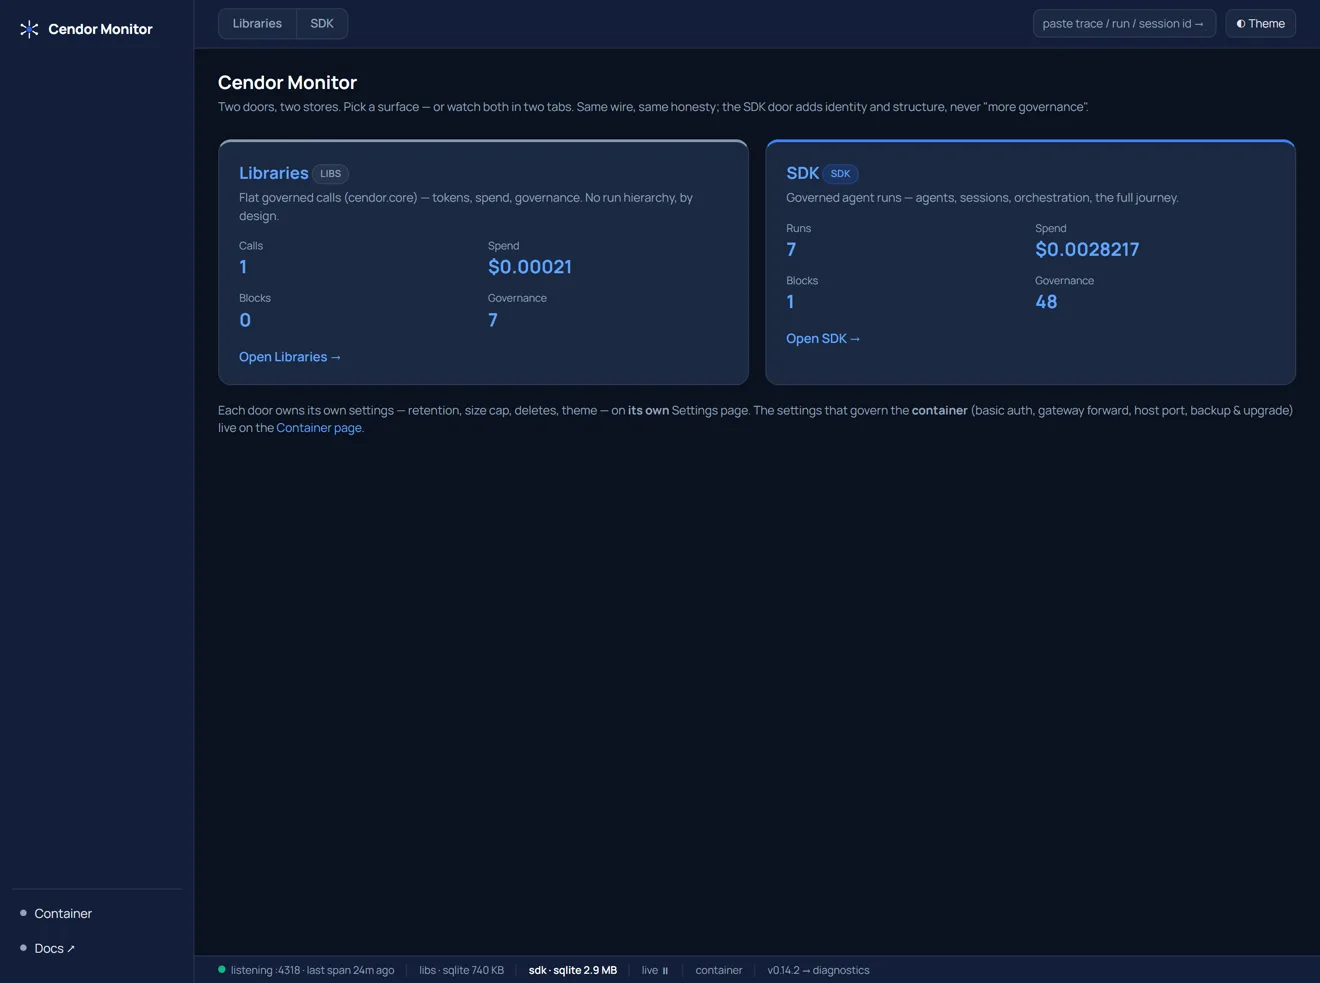
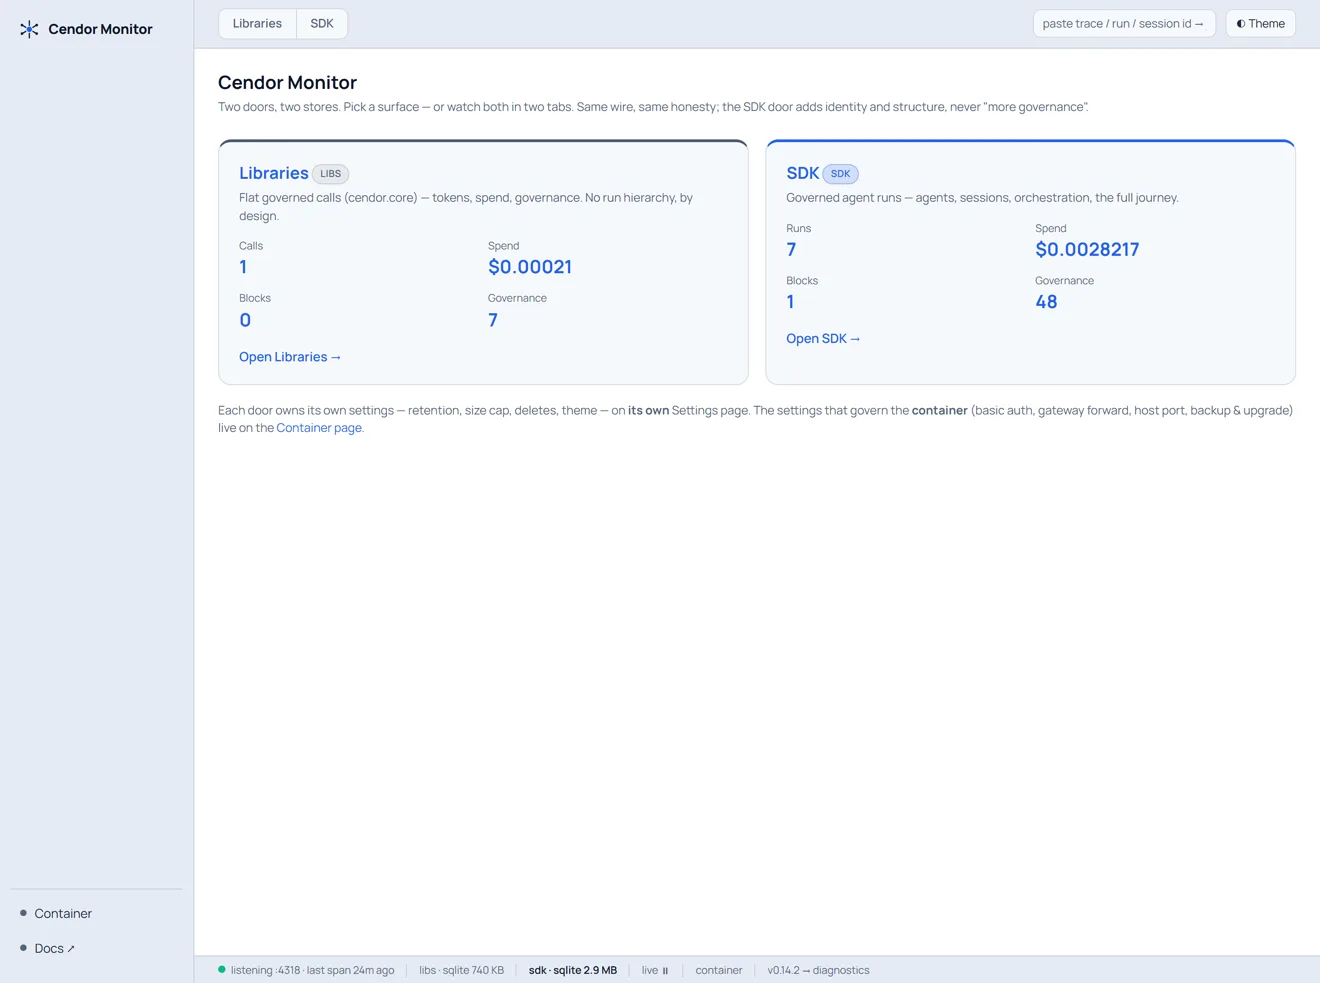
Pick a door — Libraries or SDK
The console has two doors, and each is its own store: Libraries for apps that use the libraries directly under their own framework, SDK for apps built on the Cendor agent loop. They never mix — a run lands in exactly one, every setting belongs to exactly one, and the switcher only appears once both have data. Container-level config (auth, gateway forward, backups) lives on its own door-less page, because it is not a door's setting.
Land on the Overview
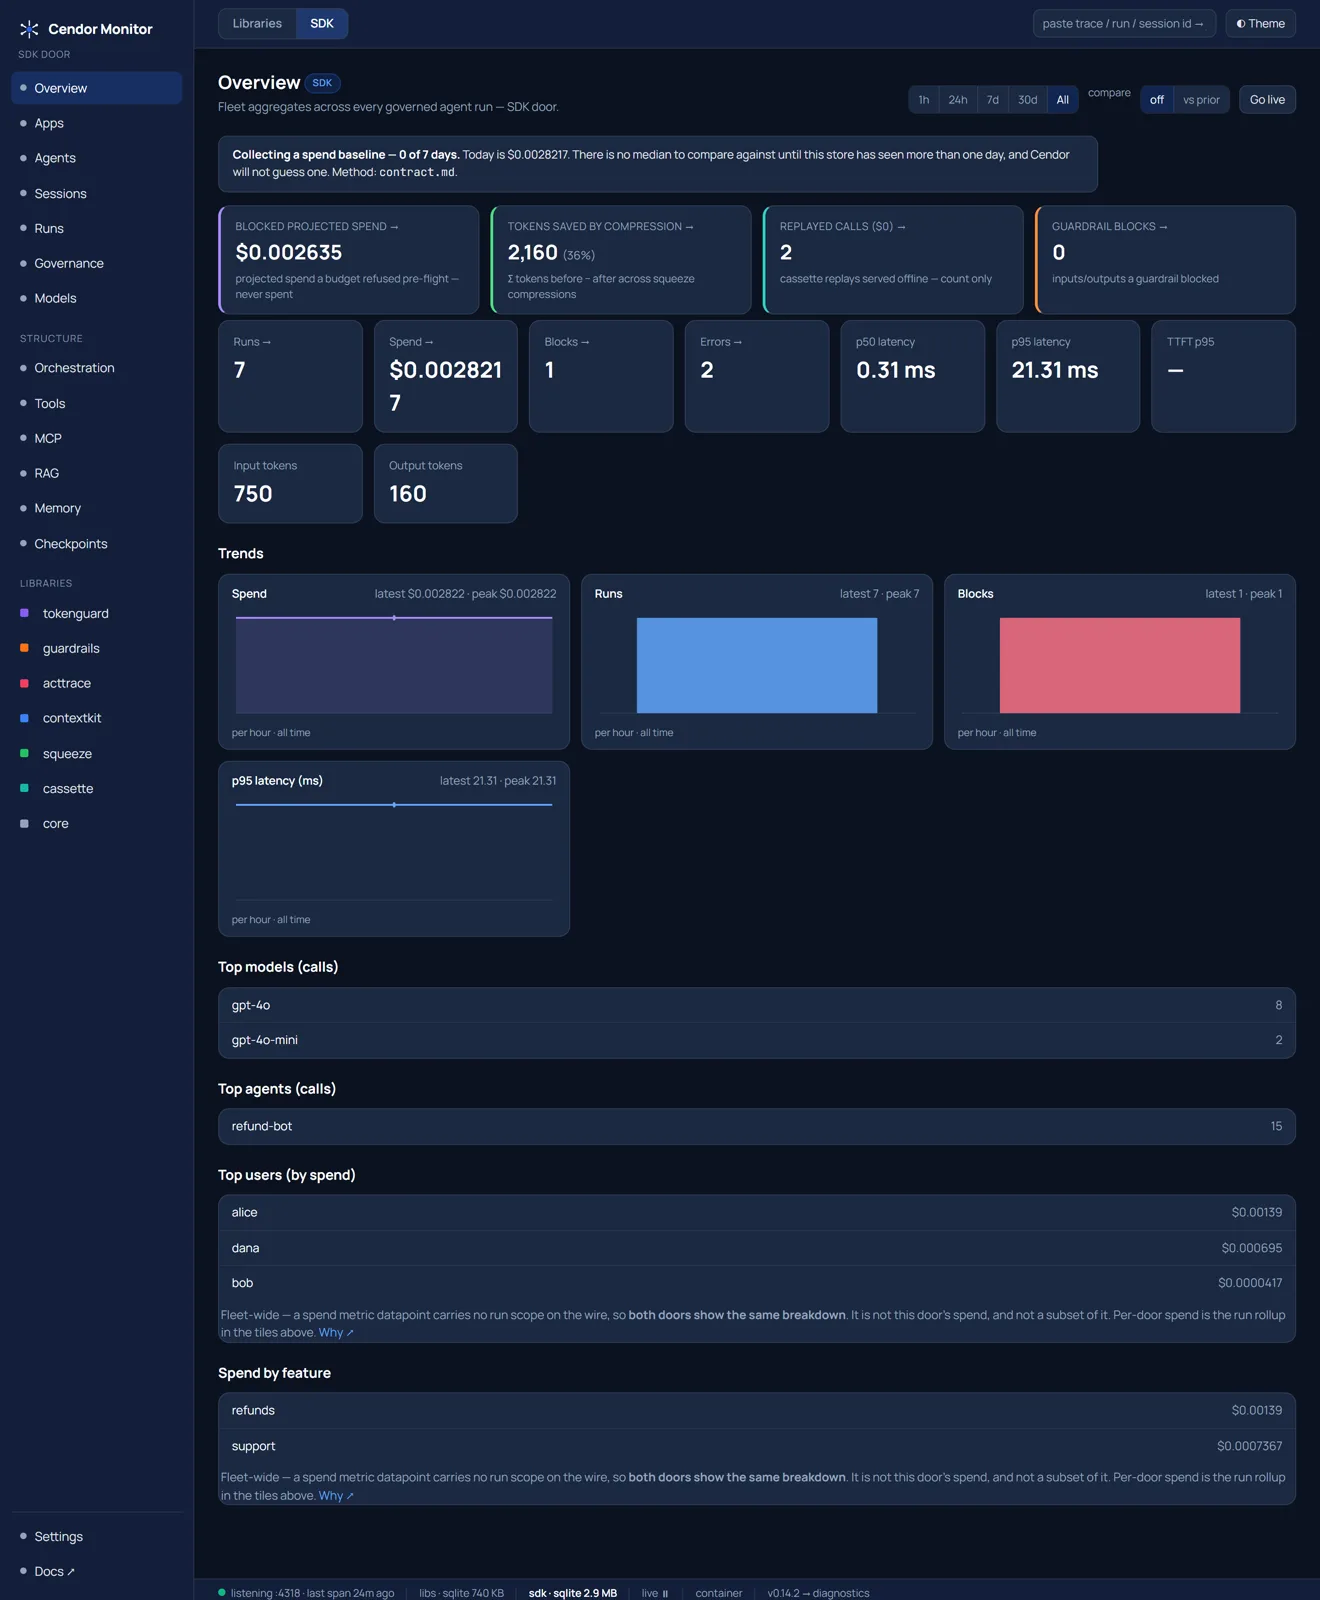
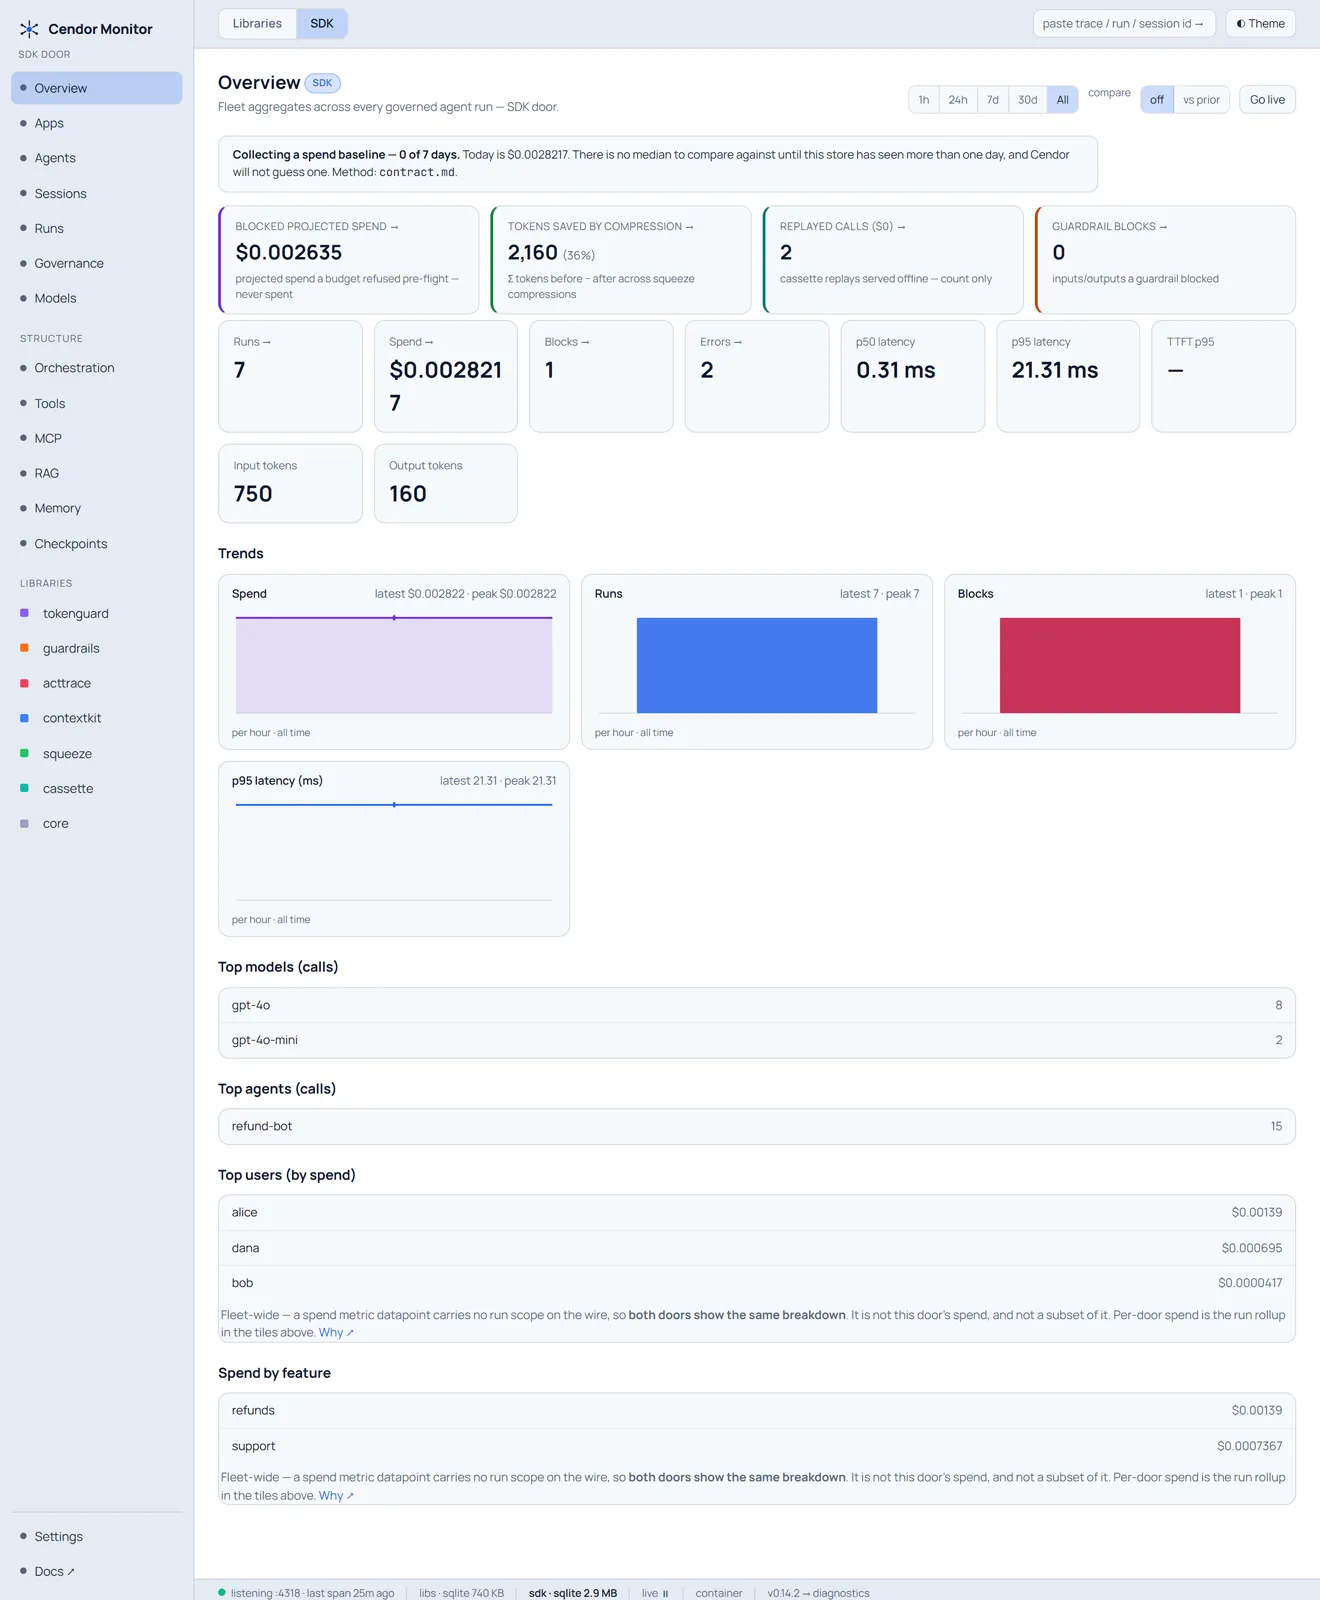
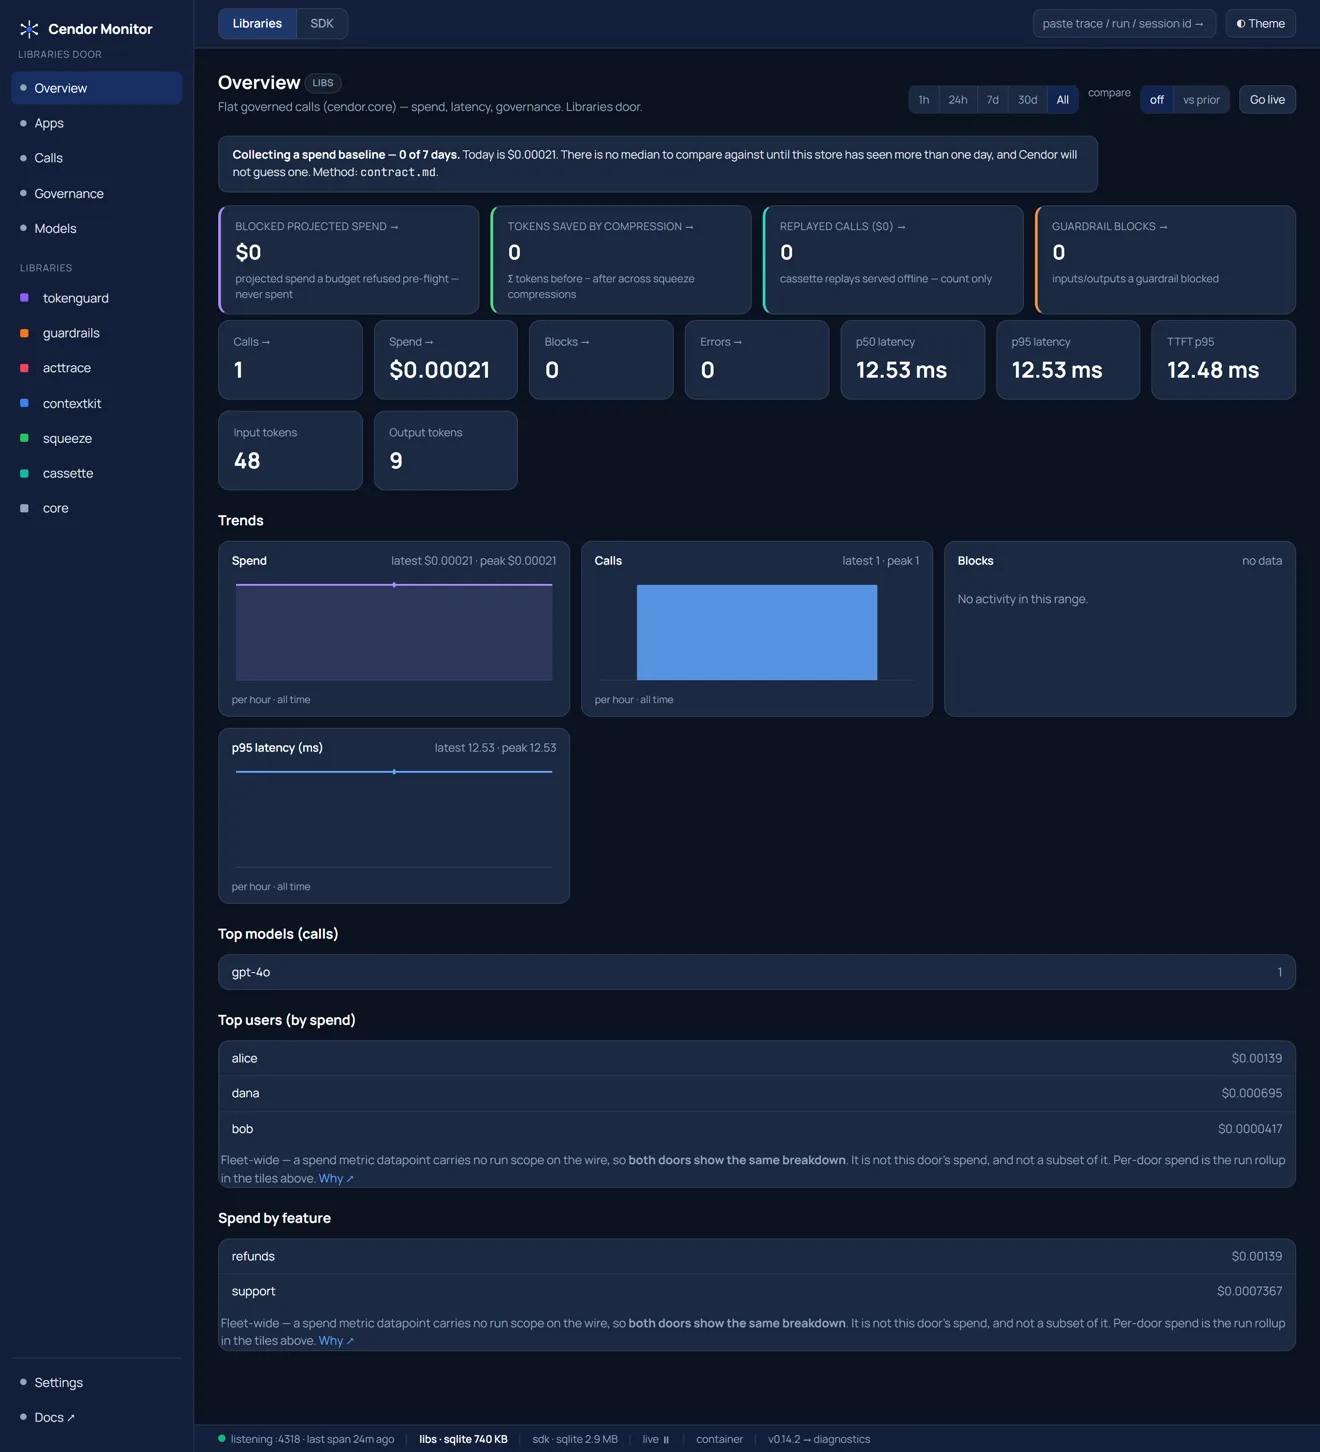
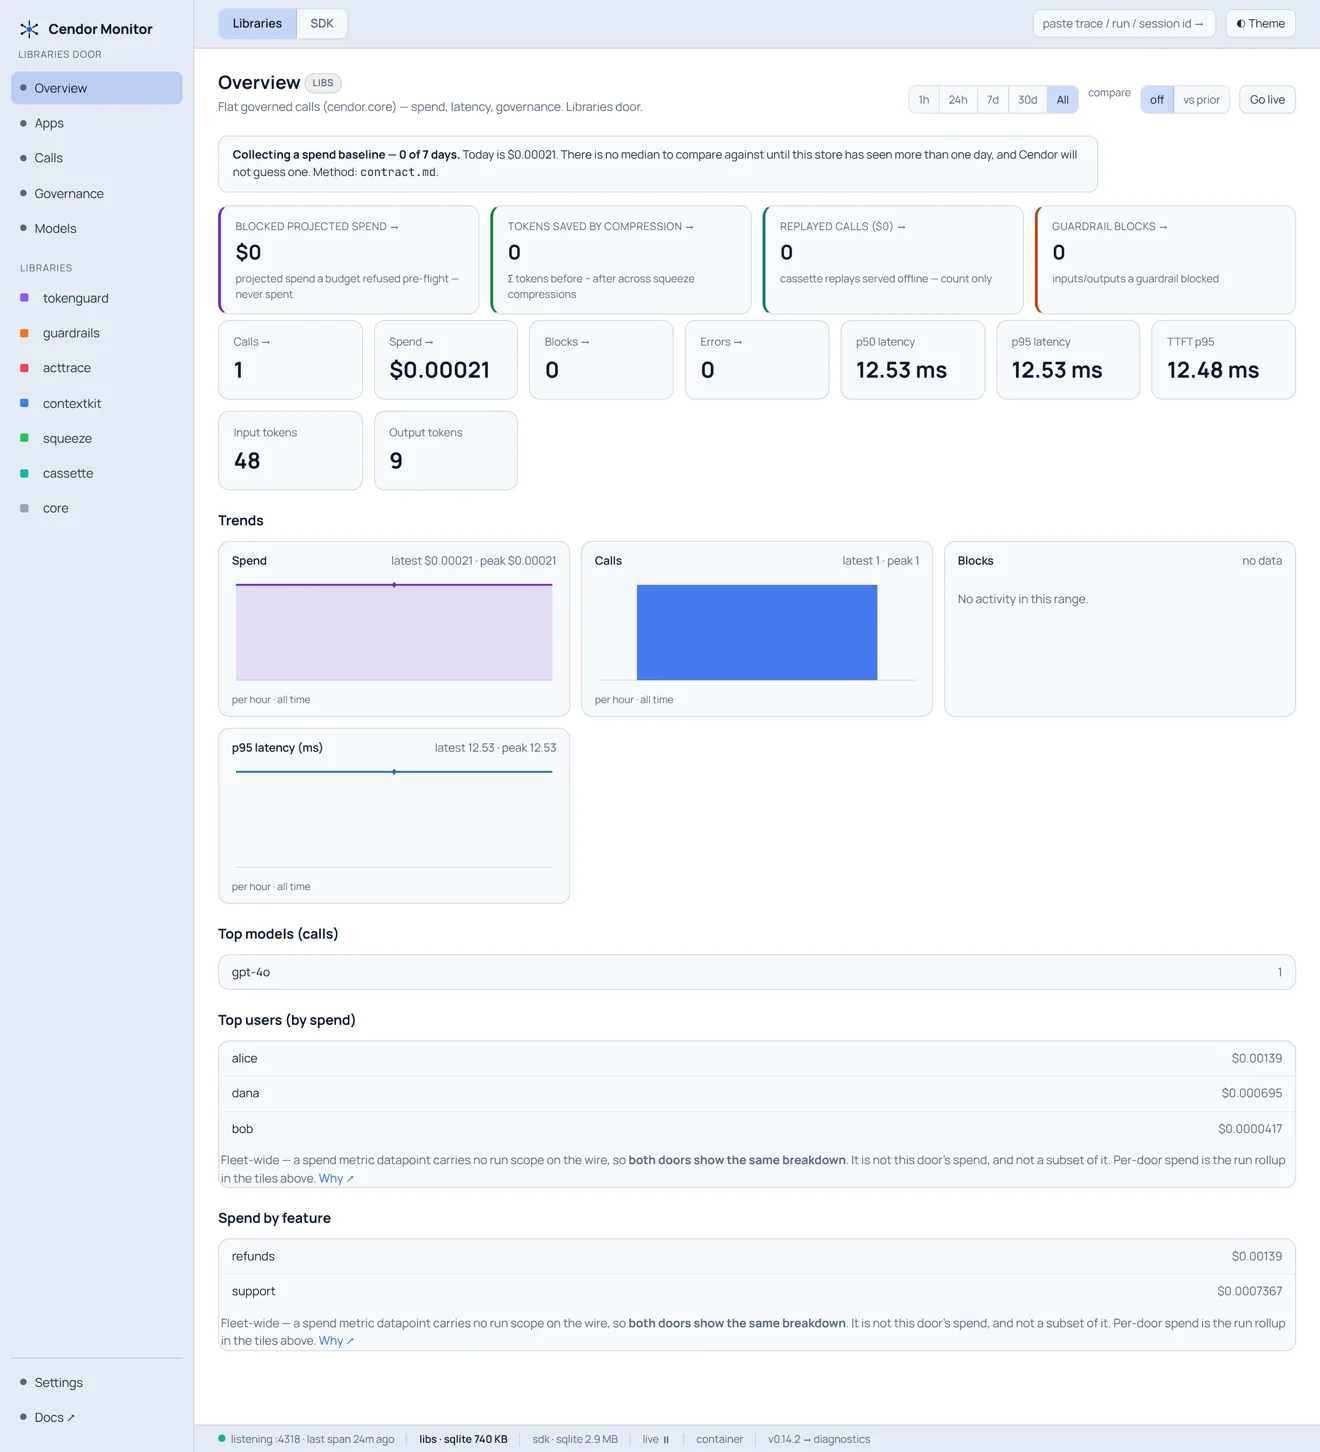
The Cendor value strip — blocked projected spend (a budget refused pre-flight, never spent), tokens saved by compression, $0 cassette replays, guardrail blocks — above the fleet tiles (runs, spend, blocks, errors, p50/p95, TTFT), dependency-free trend charts, and cost attribution: top models, top agents, top users by spend, spend by feature. A time-range row + a Go-live toggle sit up top. Recorded numbers only — no ROI math, and each spend surface carries the caveat that says what it does and does not count.
Agents → Sessions → Runs
A session groups the runs of one multi-turn conversation (auto gen_ai.conversation.id from run(session=…)) — drill from an agent to its sessions to the individual runs, no trace id to paste anywhere. An agent page lists that agent's own runs; where a framework or an Agent(id=…) supplied a real identity, it is shown as identity, never invented.
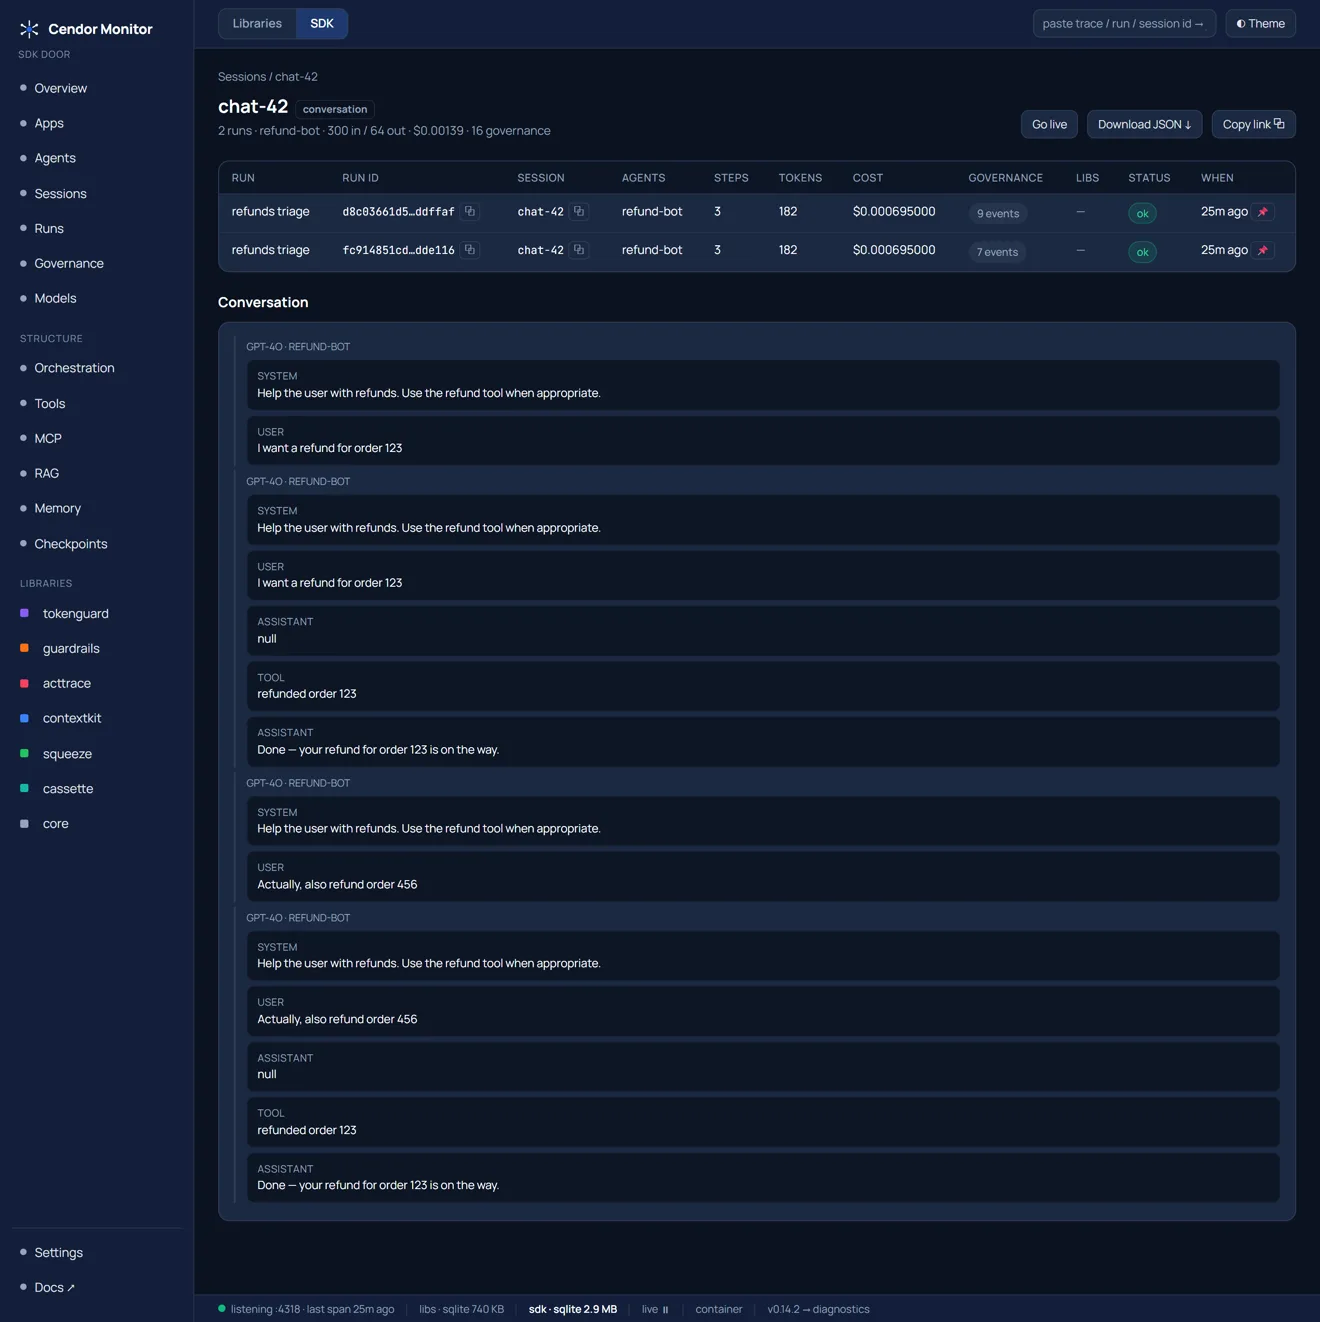
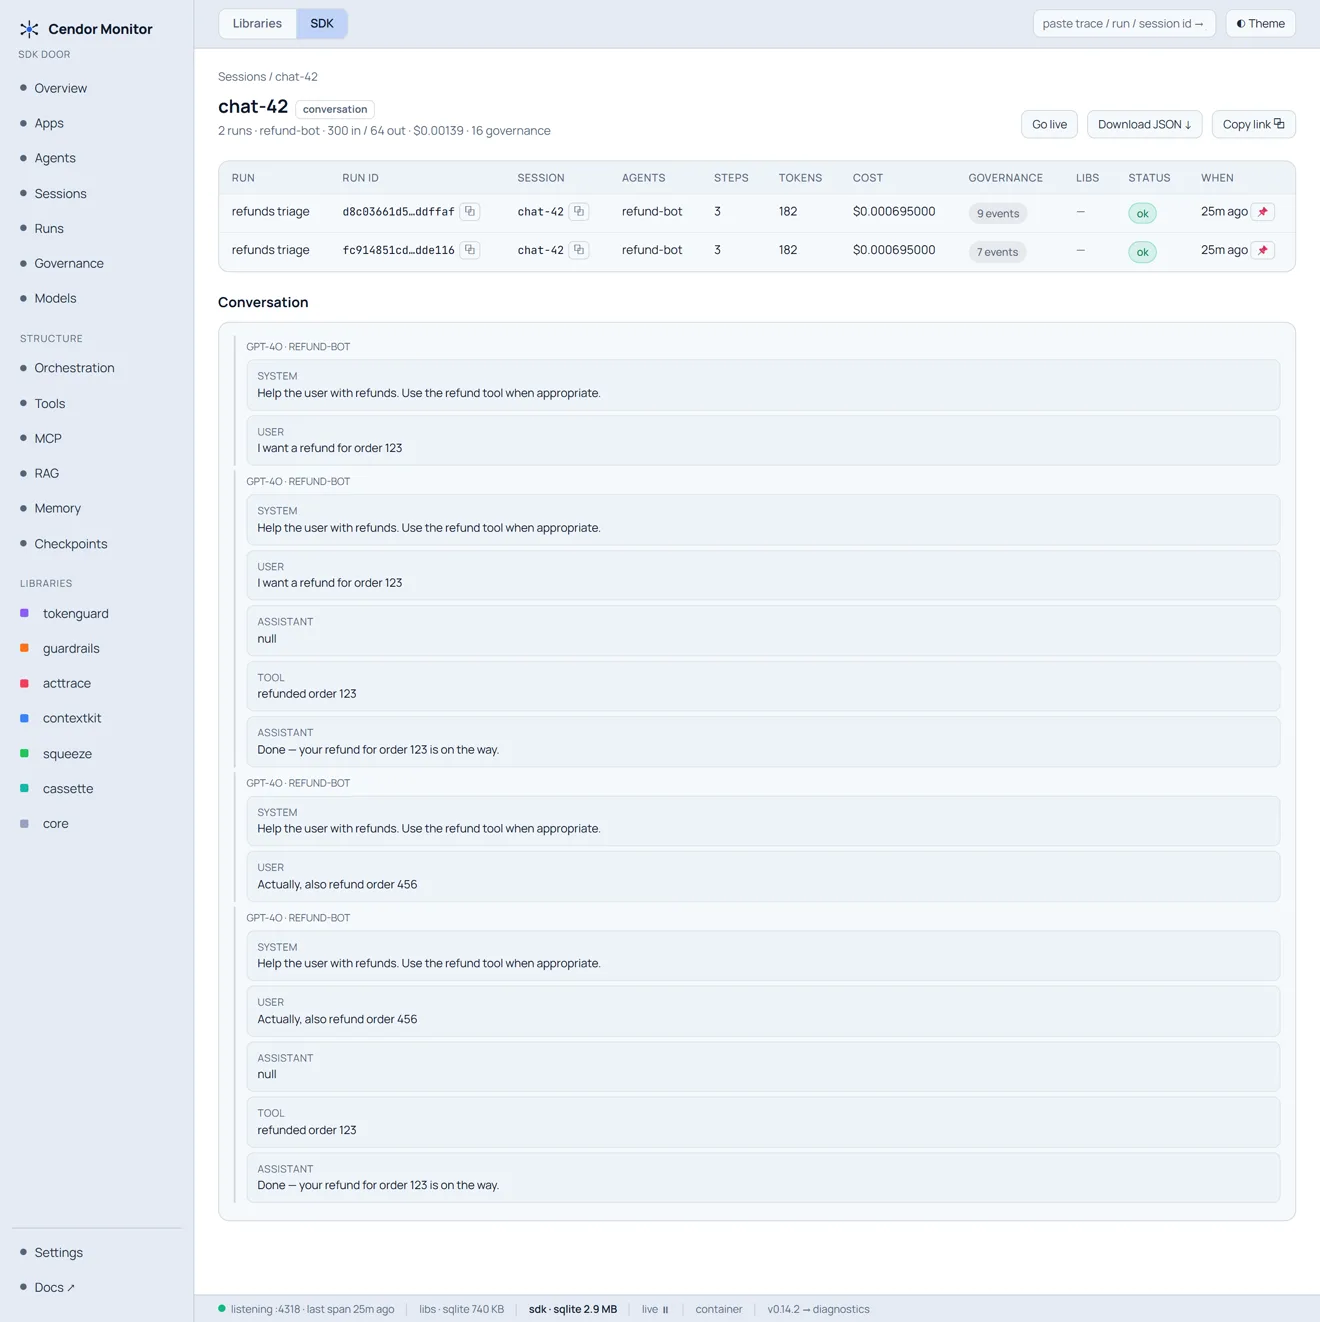
The run journey — governance inline
The whole conversation for one run — system / user / assistant / thinking / tool args + results — with tokens, cost, latency, and TTFT per step, and the exact step where a budget block, guardrail verdict, or compression fired, shown inline. Content shows only because this run opted in; the rule-6 banner is verbatim. A run's header can no longer disagree with its own body: the governance count it reports is exactly what the journey below lists.
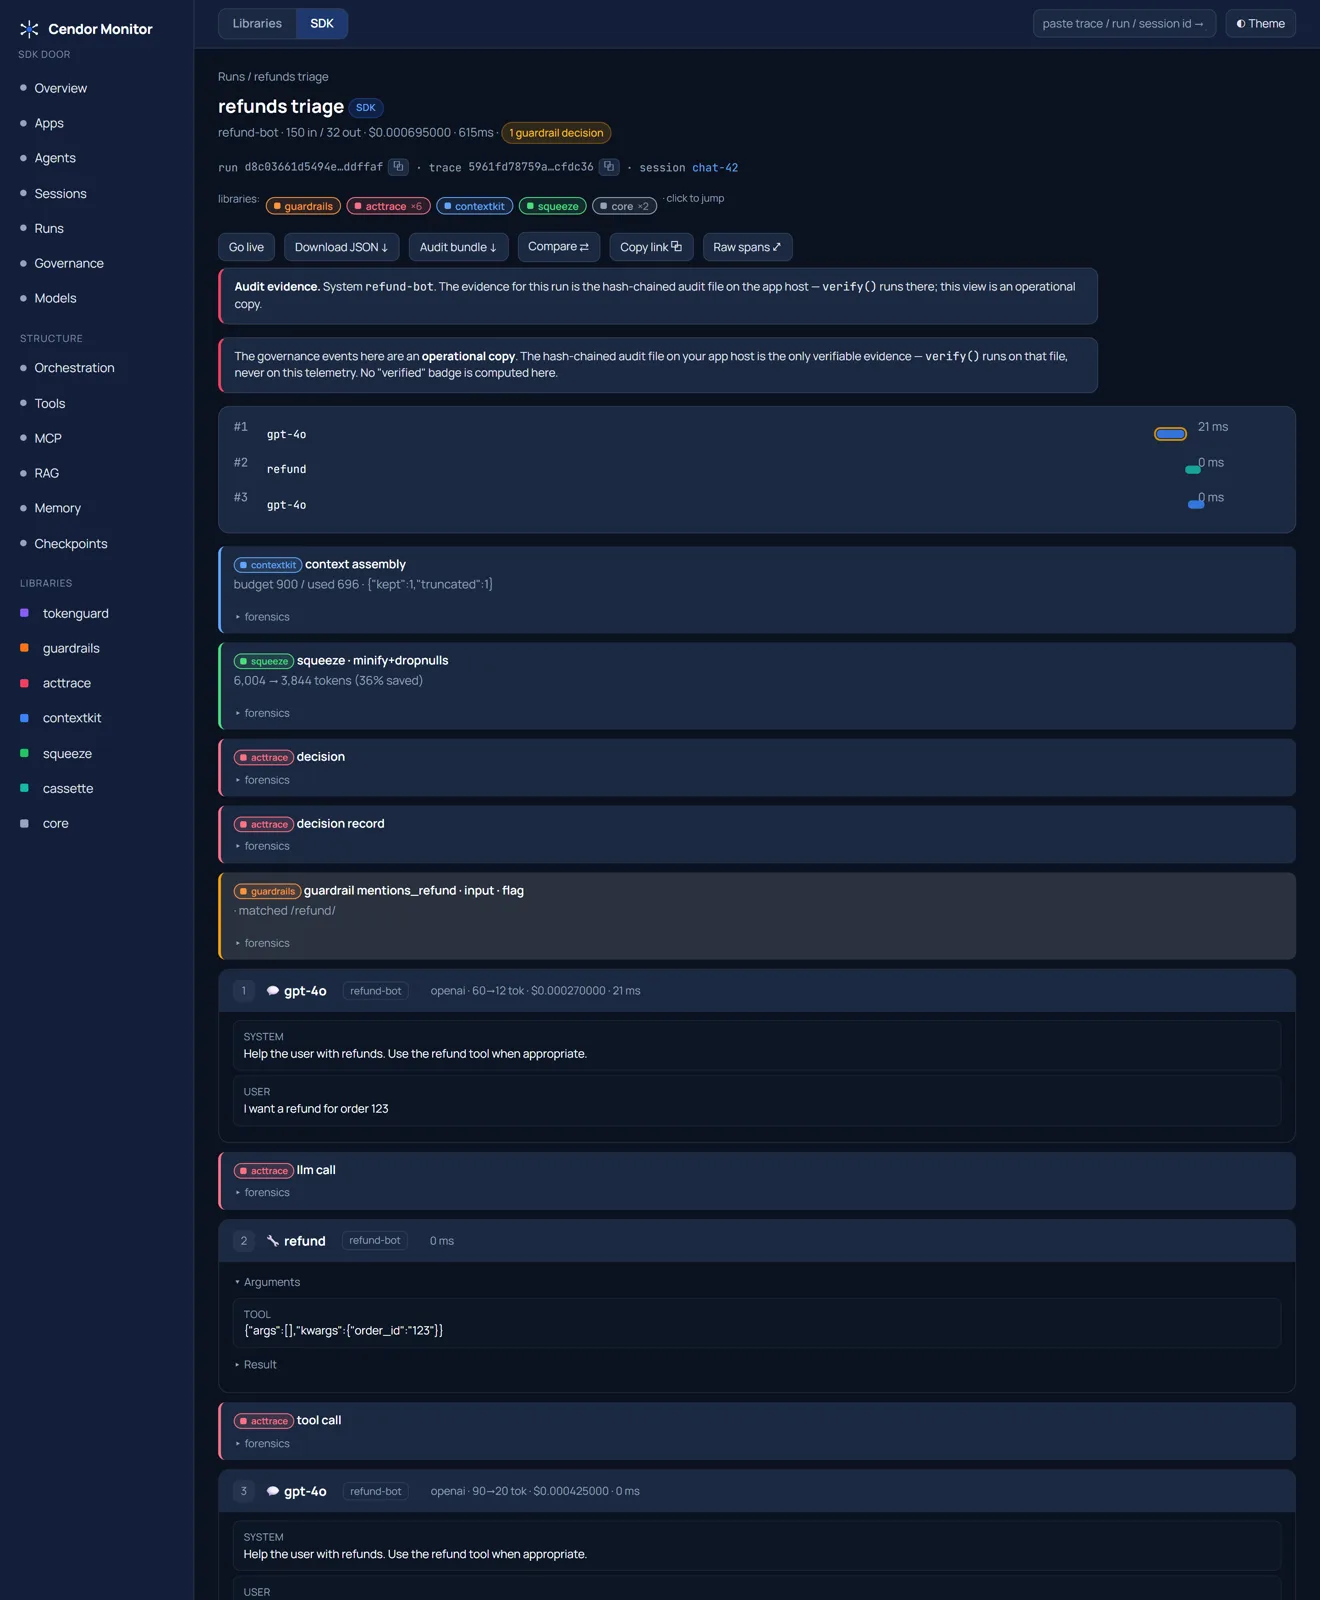
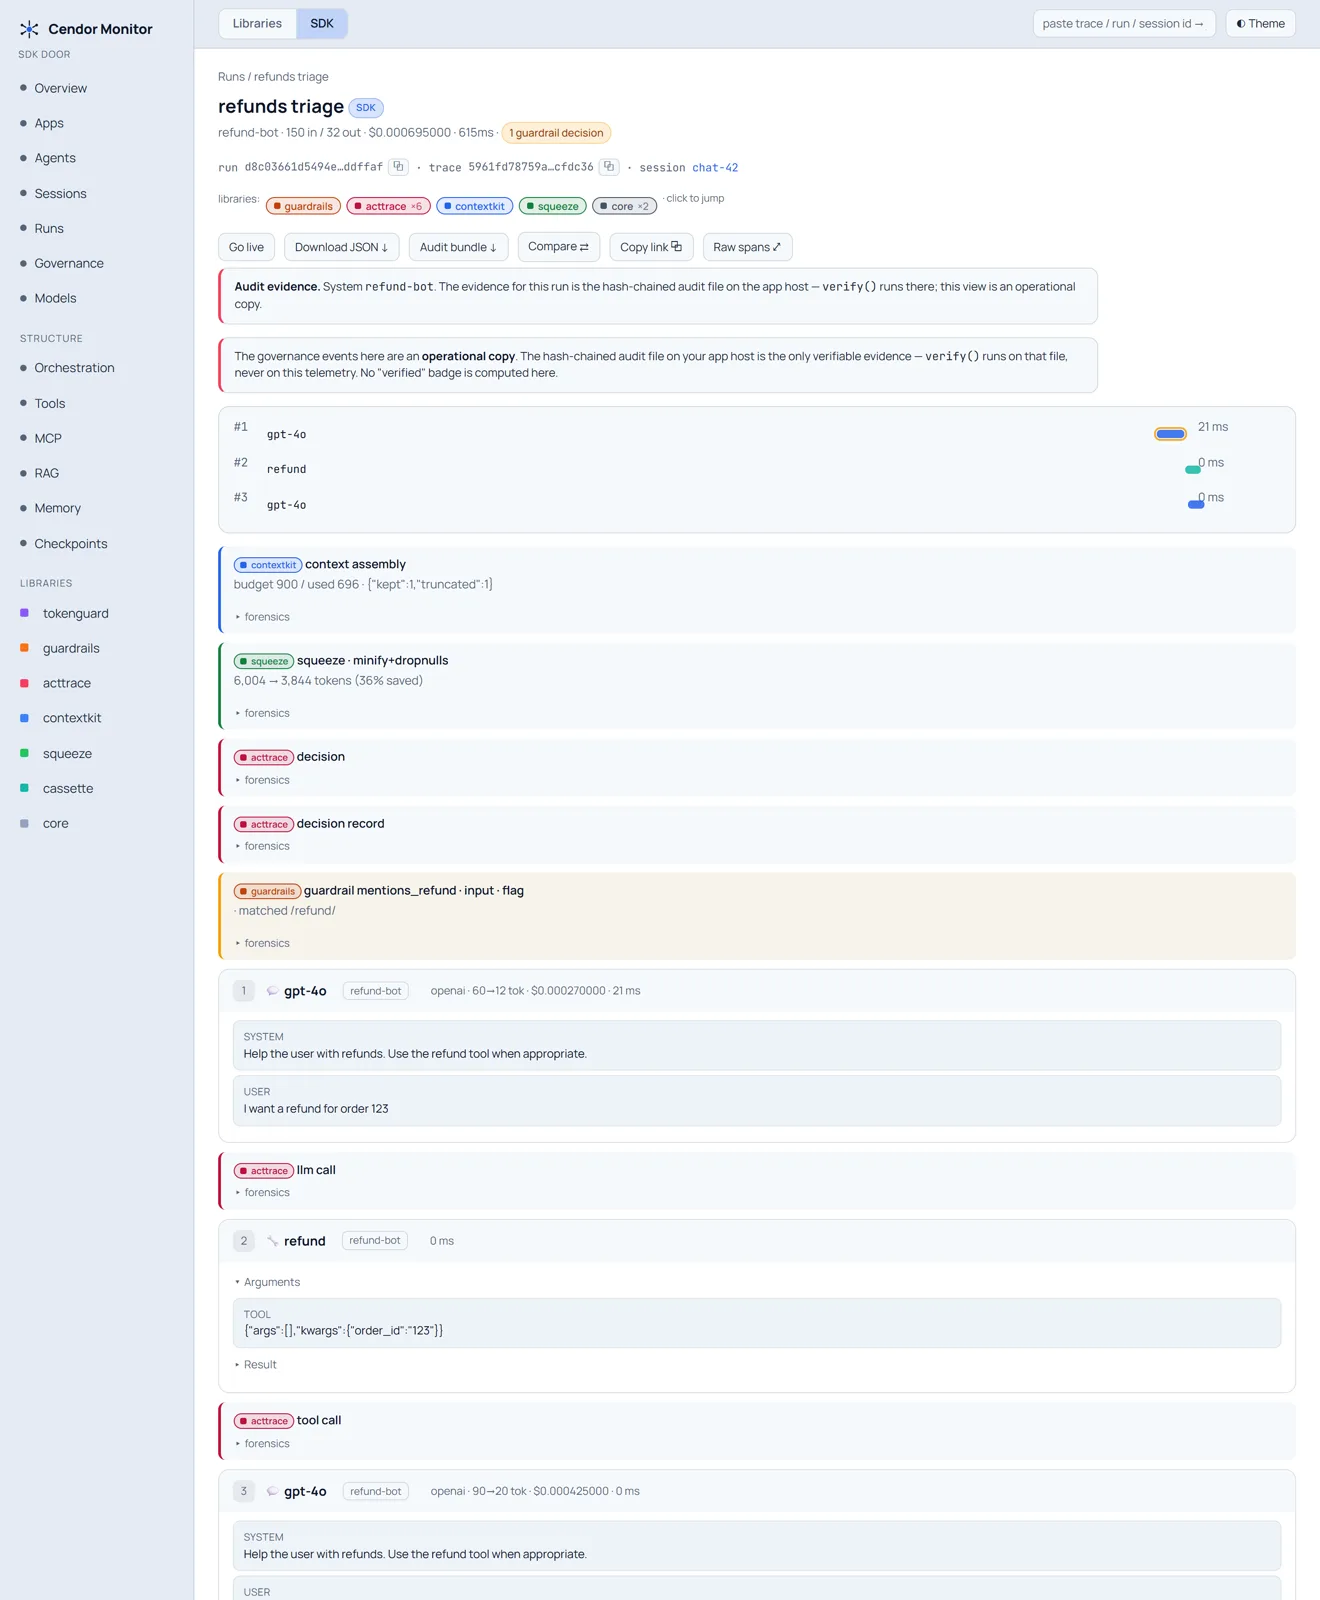
A proof page per library
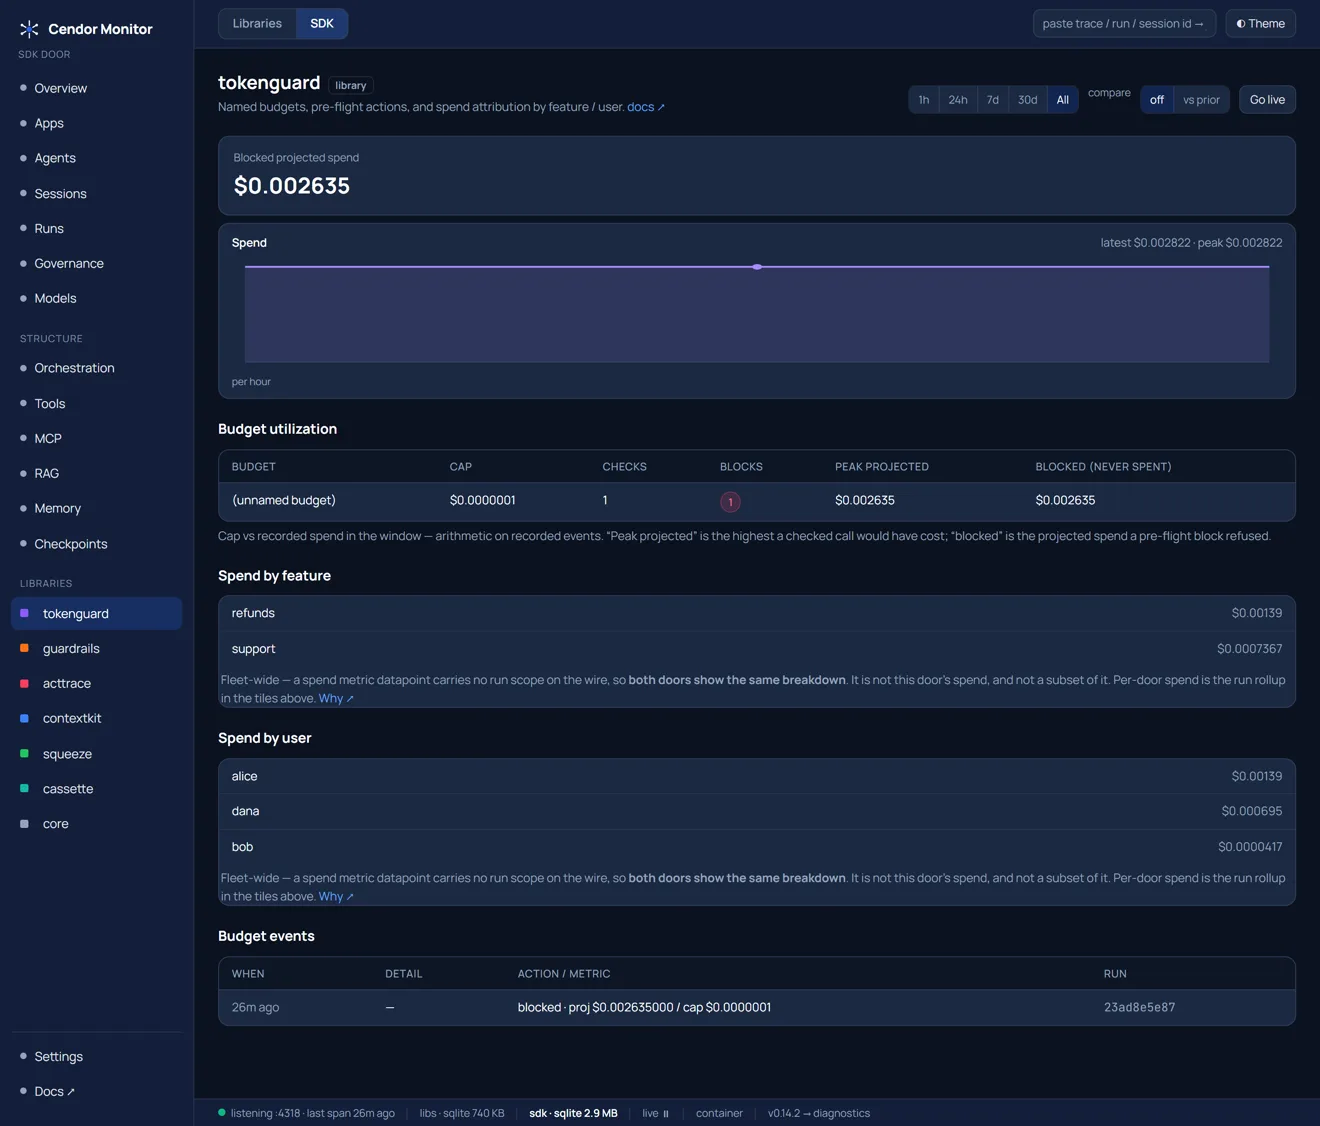
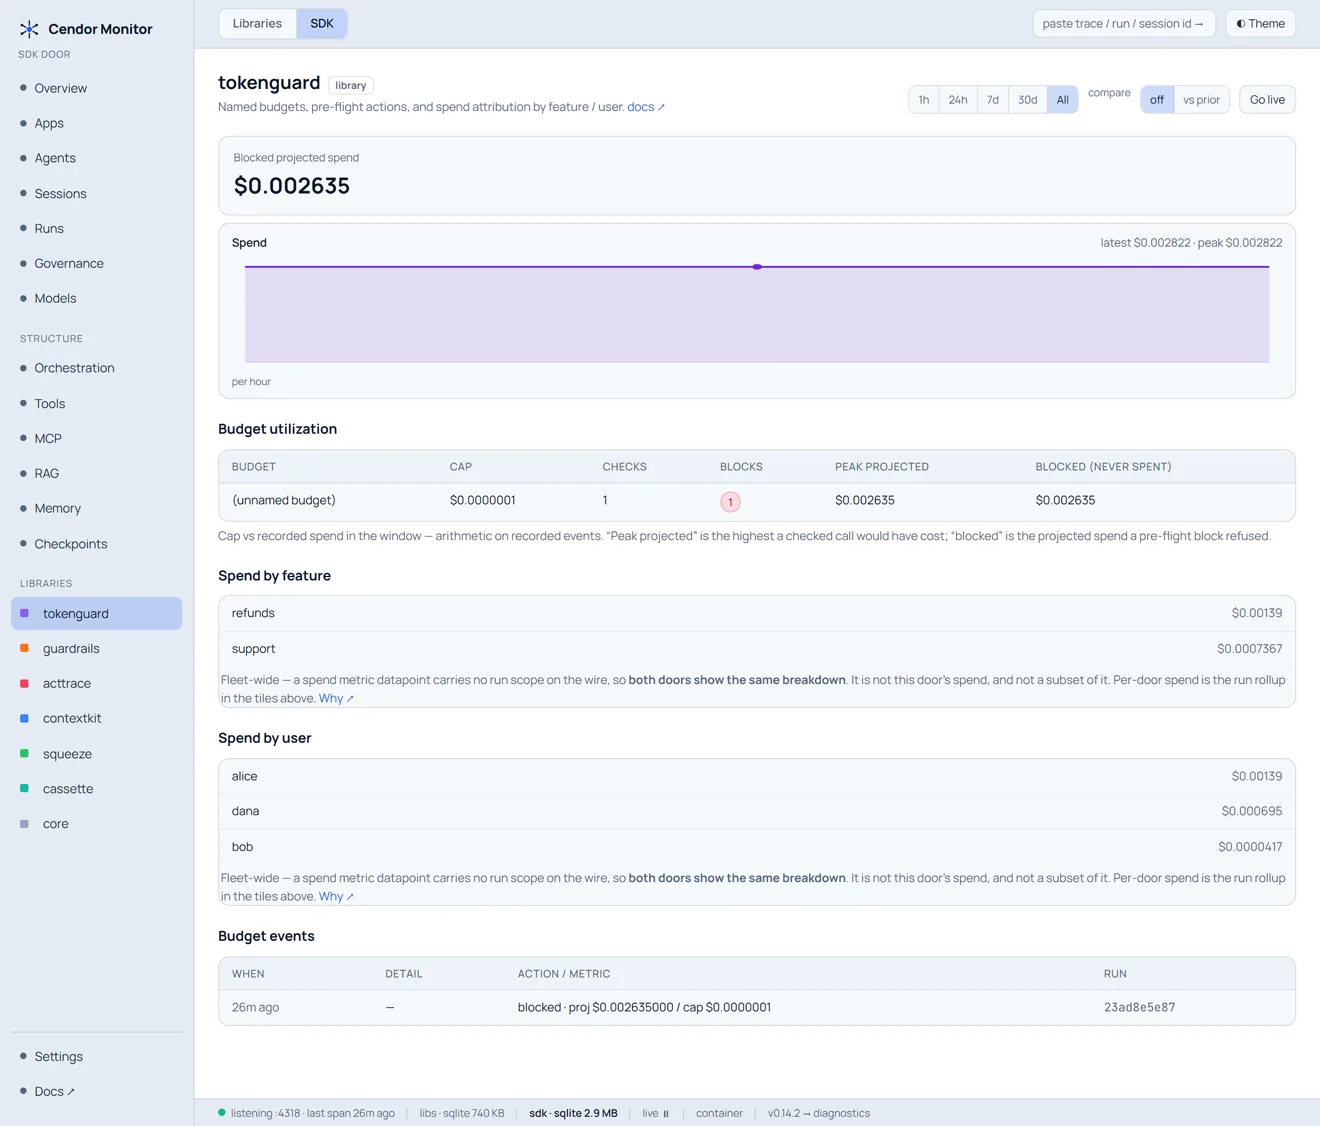
Seven per-library pages turn the monitor into proof of the libraries — each with a trend, a value tile, and the raw events. Here tokenguard: spend attributed by feature and by user, a blocked-projected-spend tile, and the budget-events table (which budget blocked what — projected vs cap). squeeze's page shows compression events (before/after tokens, metadata only, never text).
The governance stream
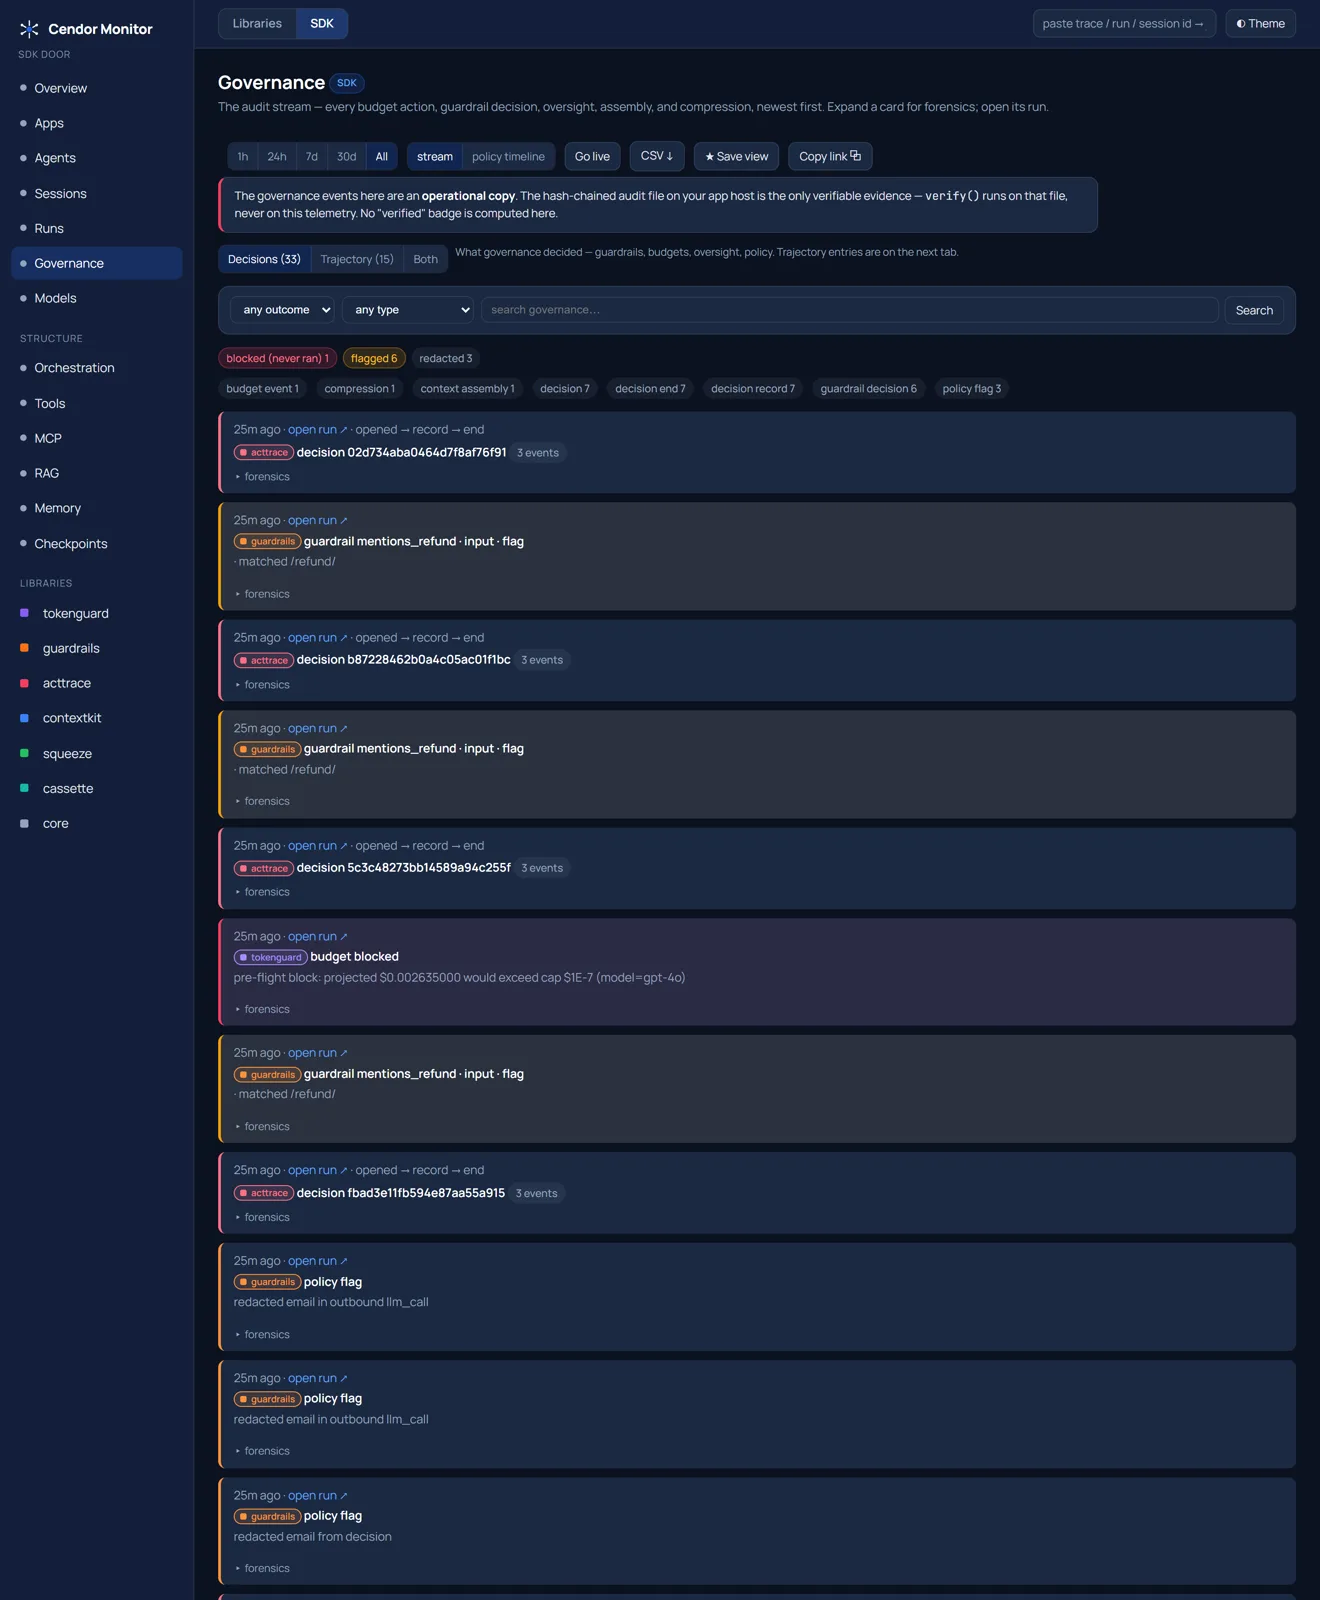
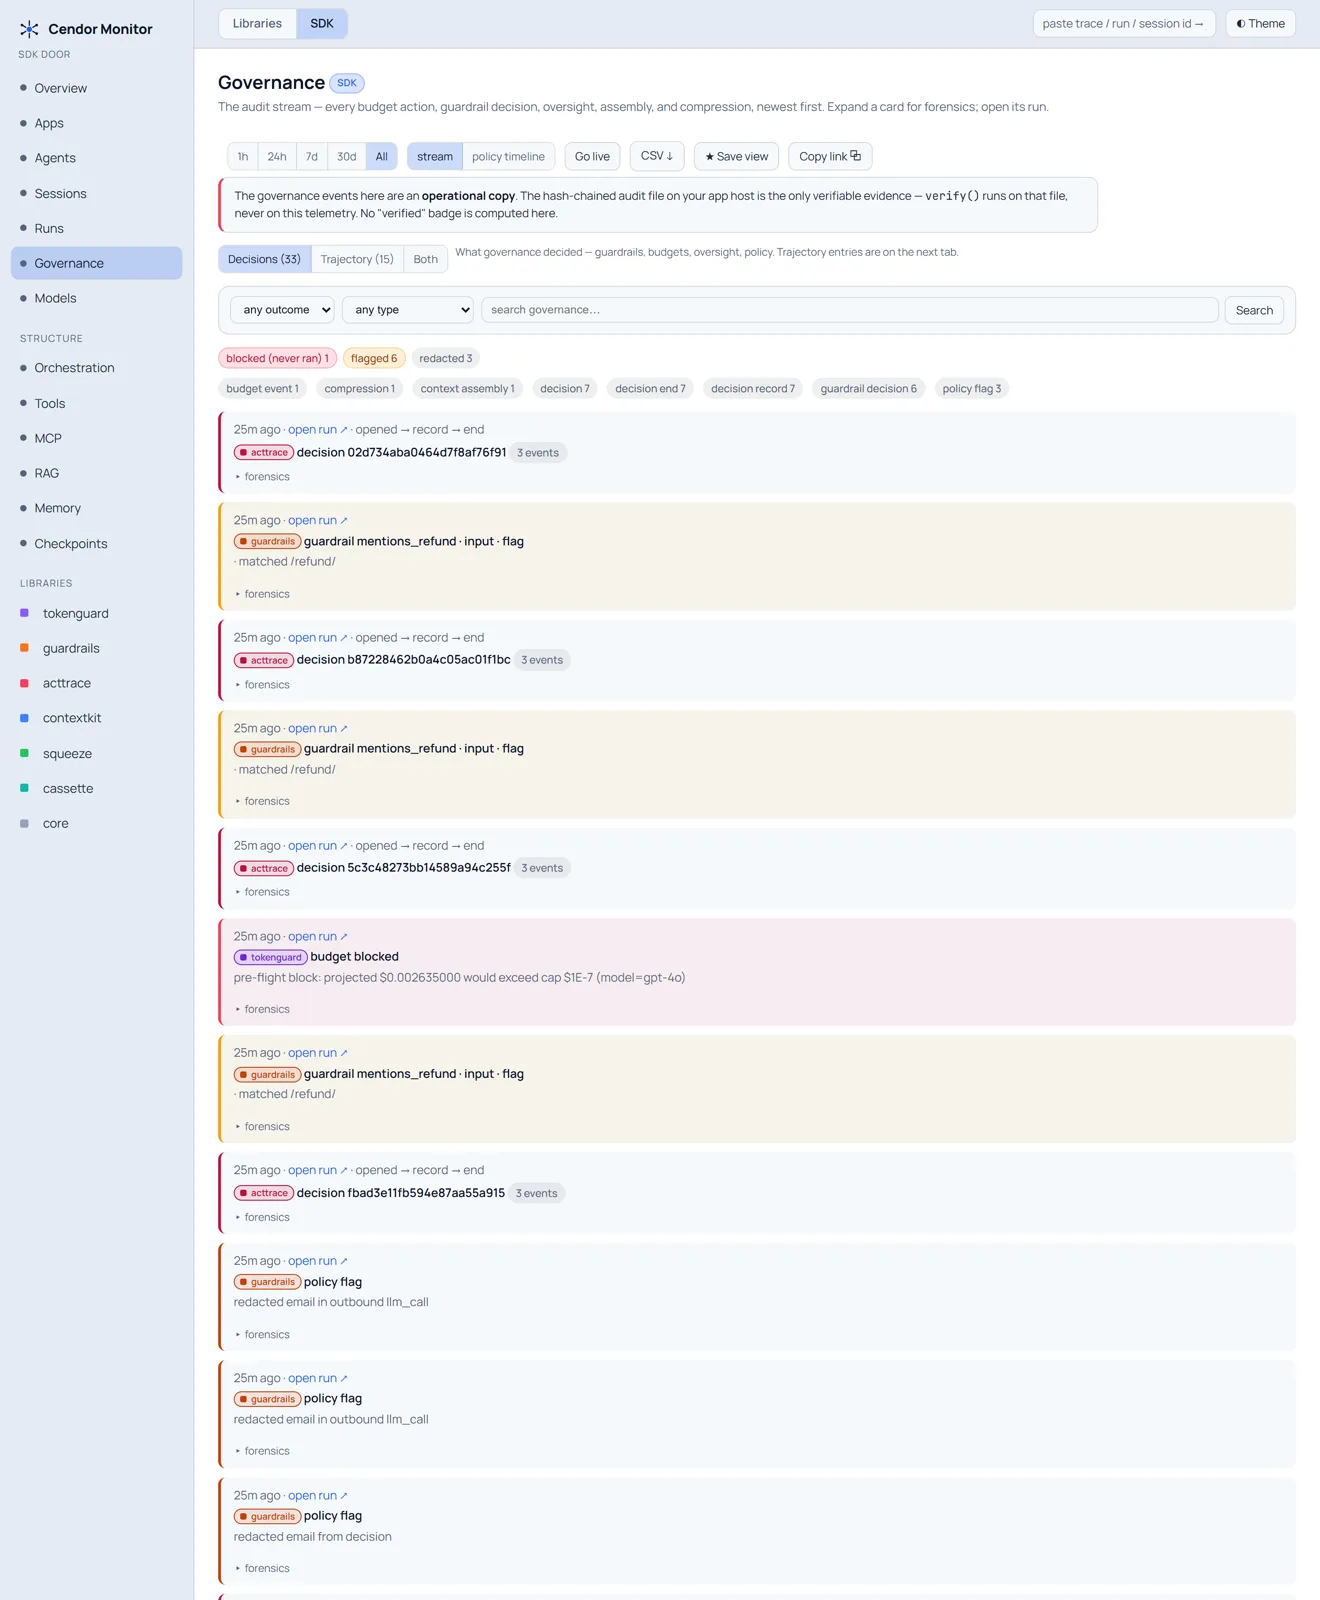
Every decision, budget event, and guardrail action as a typed stream with counters, split so the verdicts (what governance decided — blocked, flagged, redacted) come before the trajectory (what the agent did). Runs, Sessions, and Governance share a filter bar (facet dropdowns + free-text + time-range + sort + paging, all deep-linked); the free-text box toggles between metadata and a real indexed content search — over what you opted to store. A live toggle (off by default) refreshes as runs land.
The other door — libraries, no SDK
An app that never touches the SDK still gets its own overview, its calls grouped the way core.trace() grouped them (one scope is one trace, with numbered steps), its governance, its models, and the same seven proof pages. Agent vocabulary appears here only when a framework adapter actually attached an agent — a plain libraries app sees none, rather than a placeholder.
Config, per door
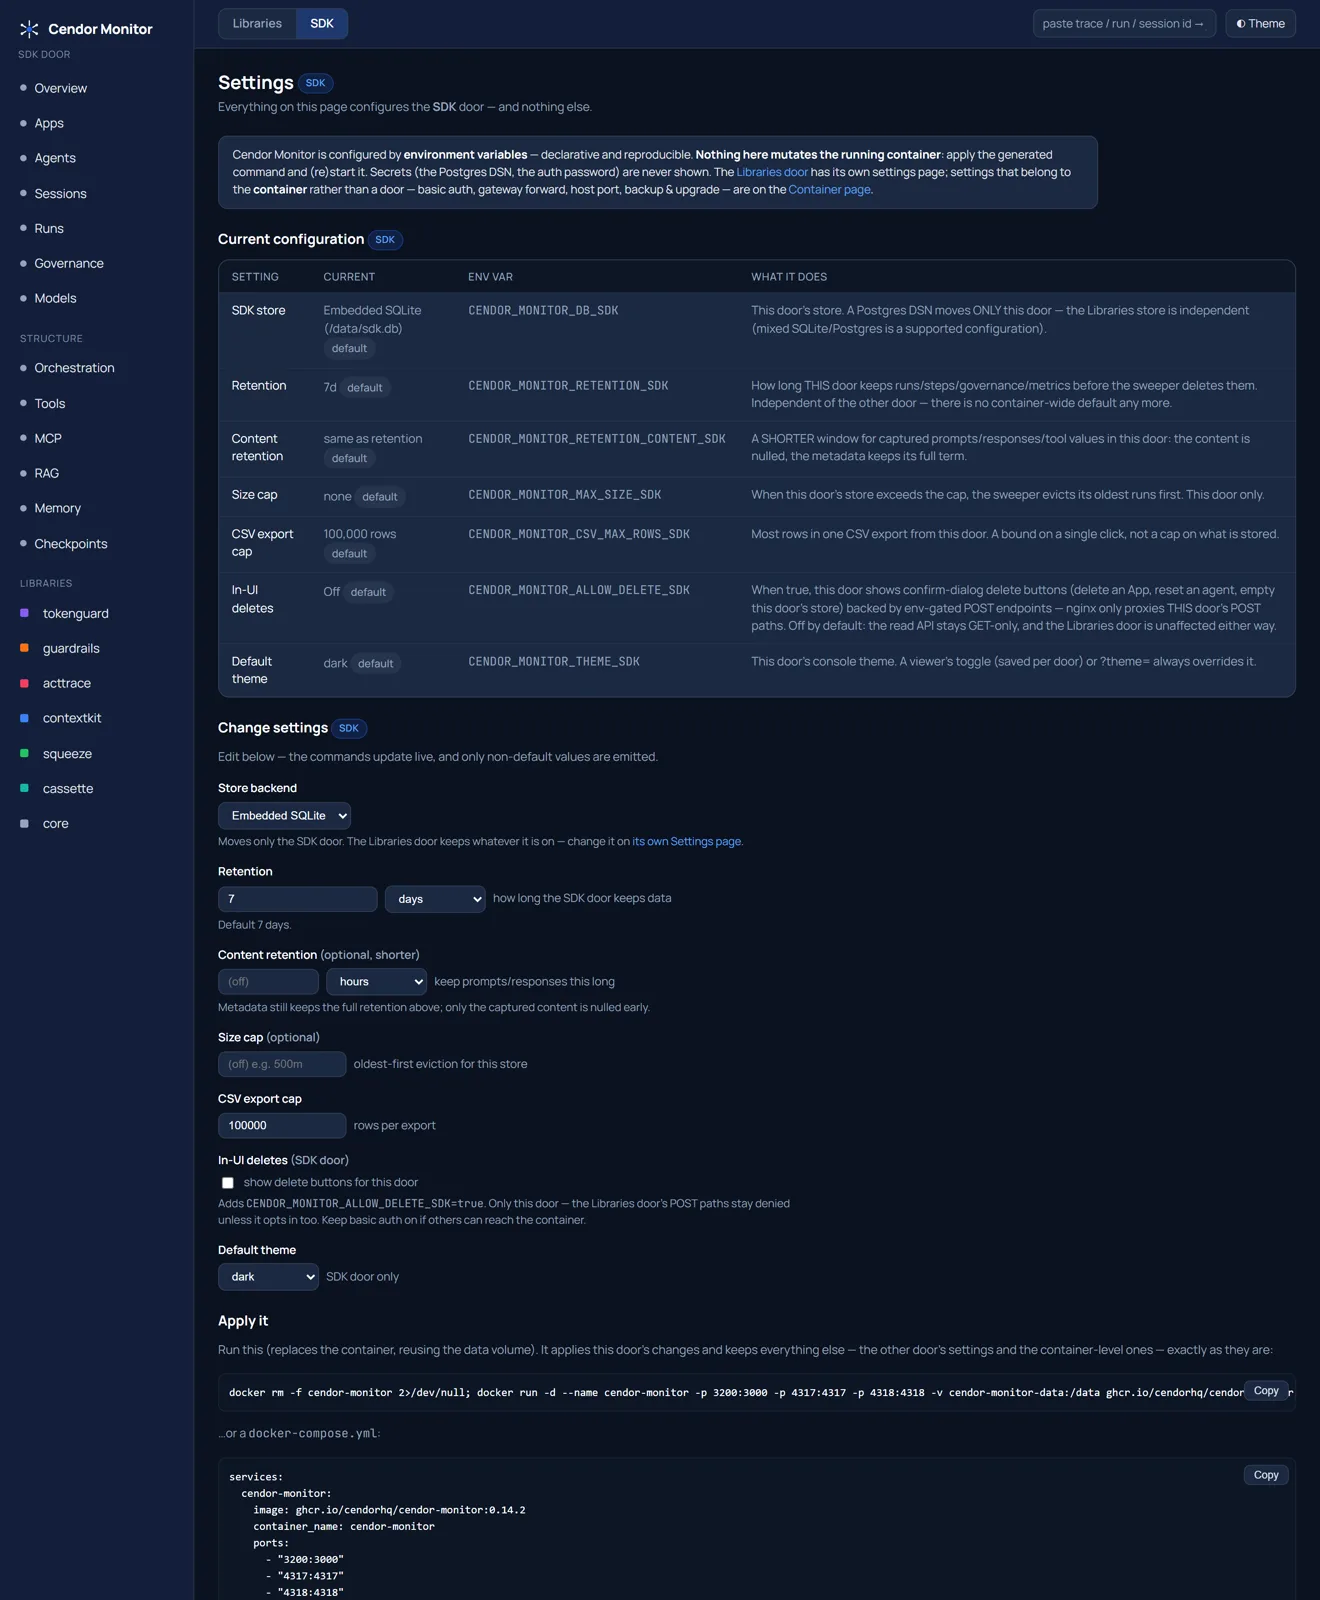
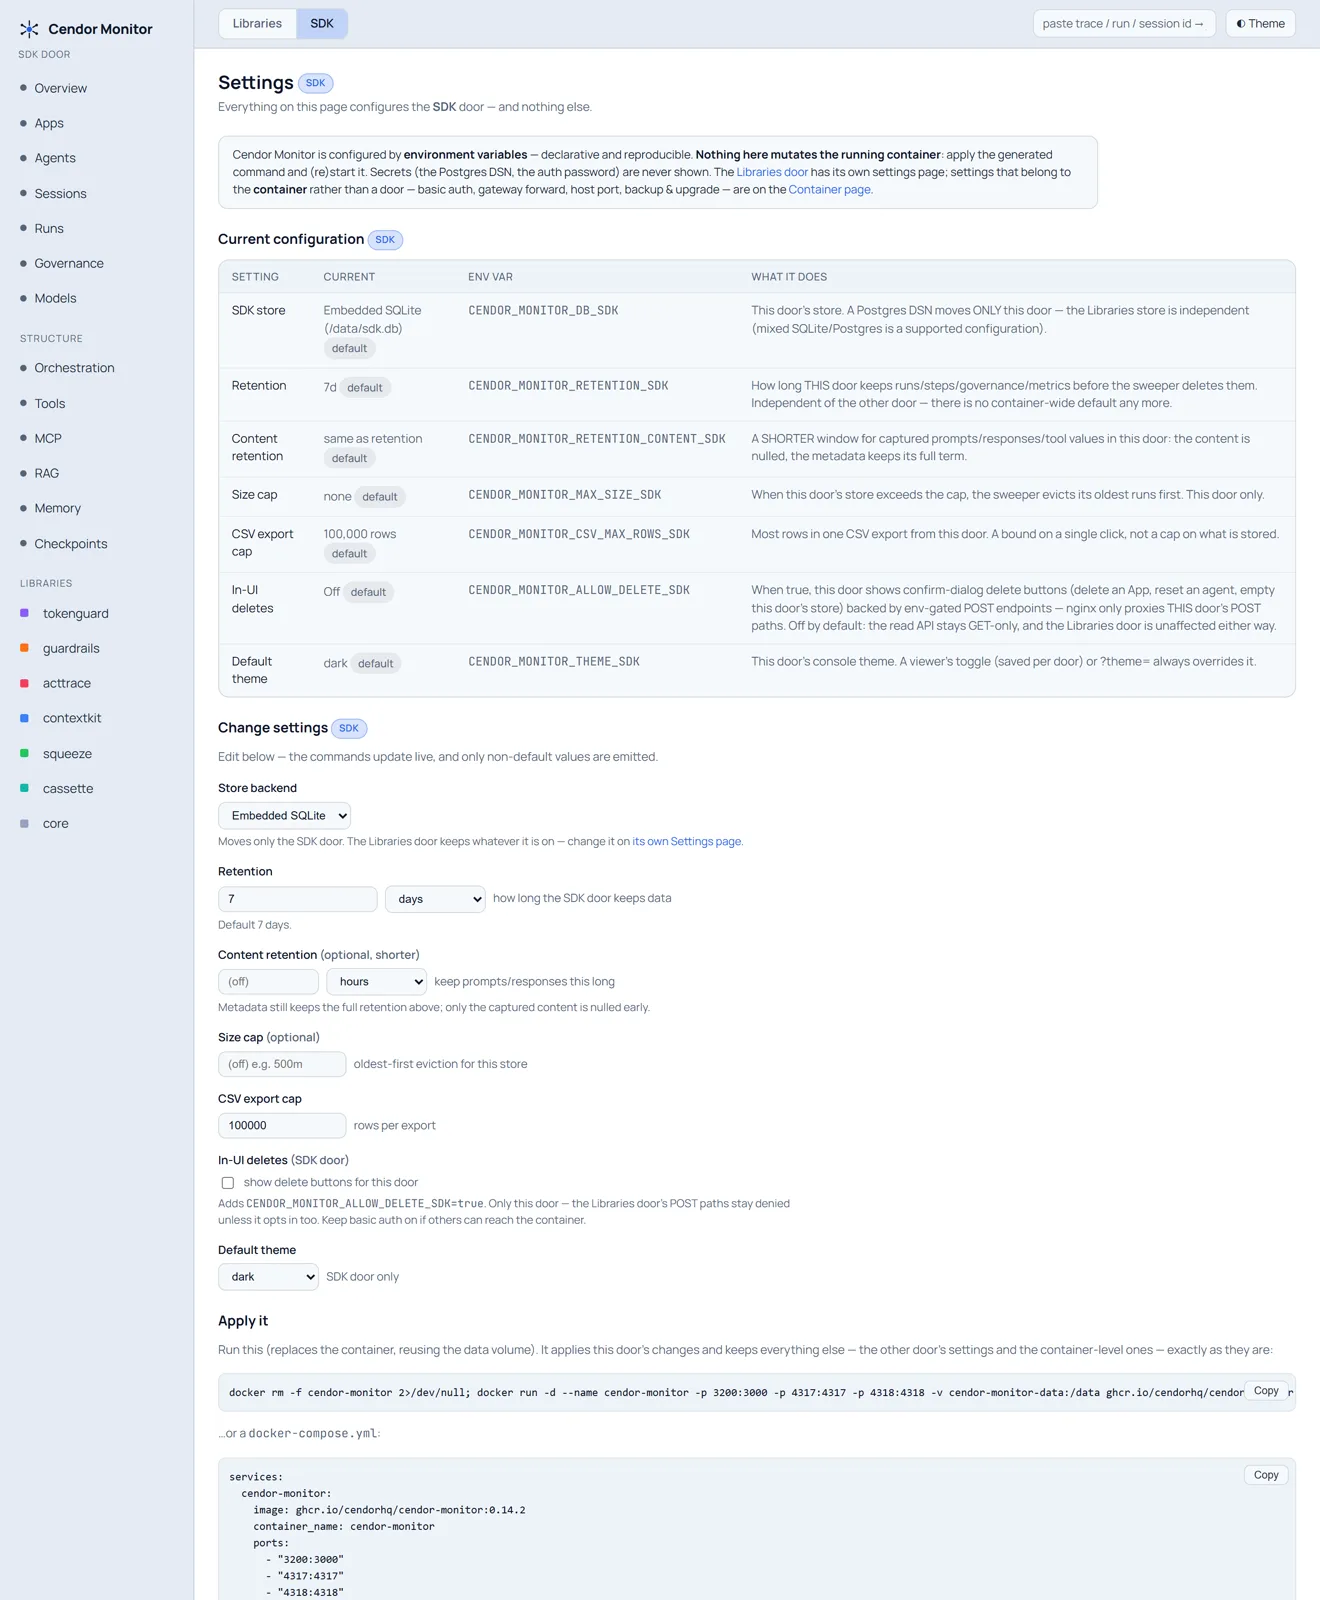
A read-only reference of how this door is configured — theme, retention, storage backend, content-capture status, CSV caps — where every value names the exact environment variable behind it. A door's Settings never shows a value that also governs the other door.
The container, on its own page
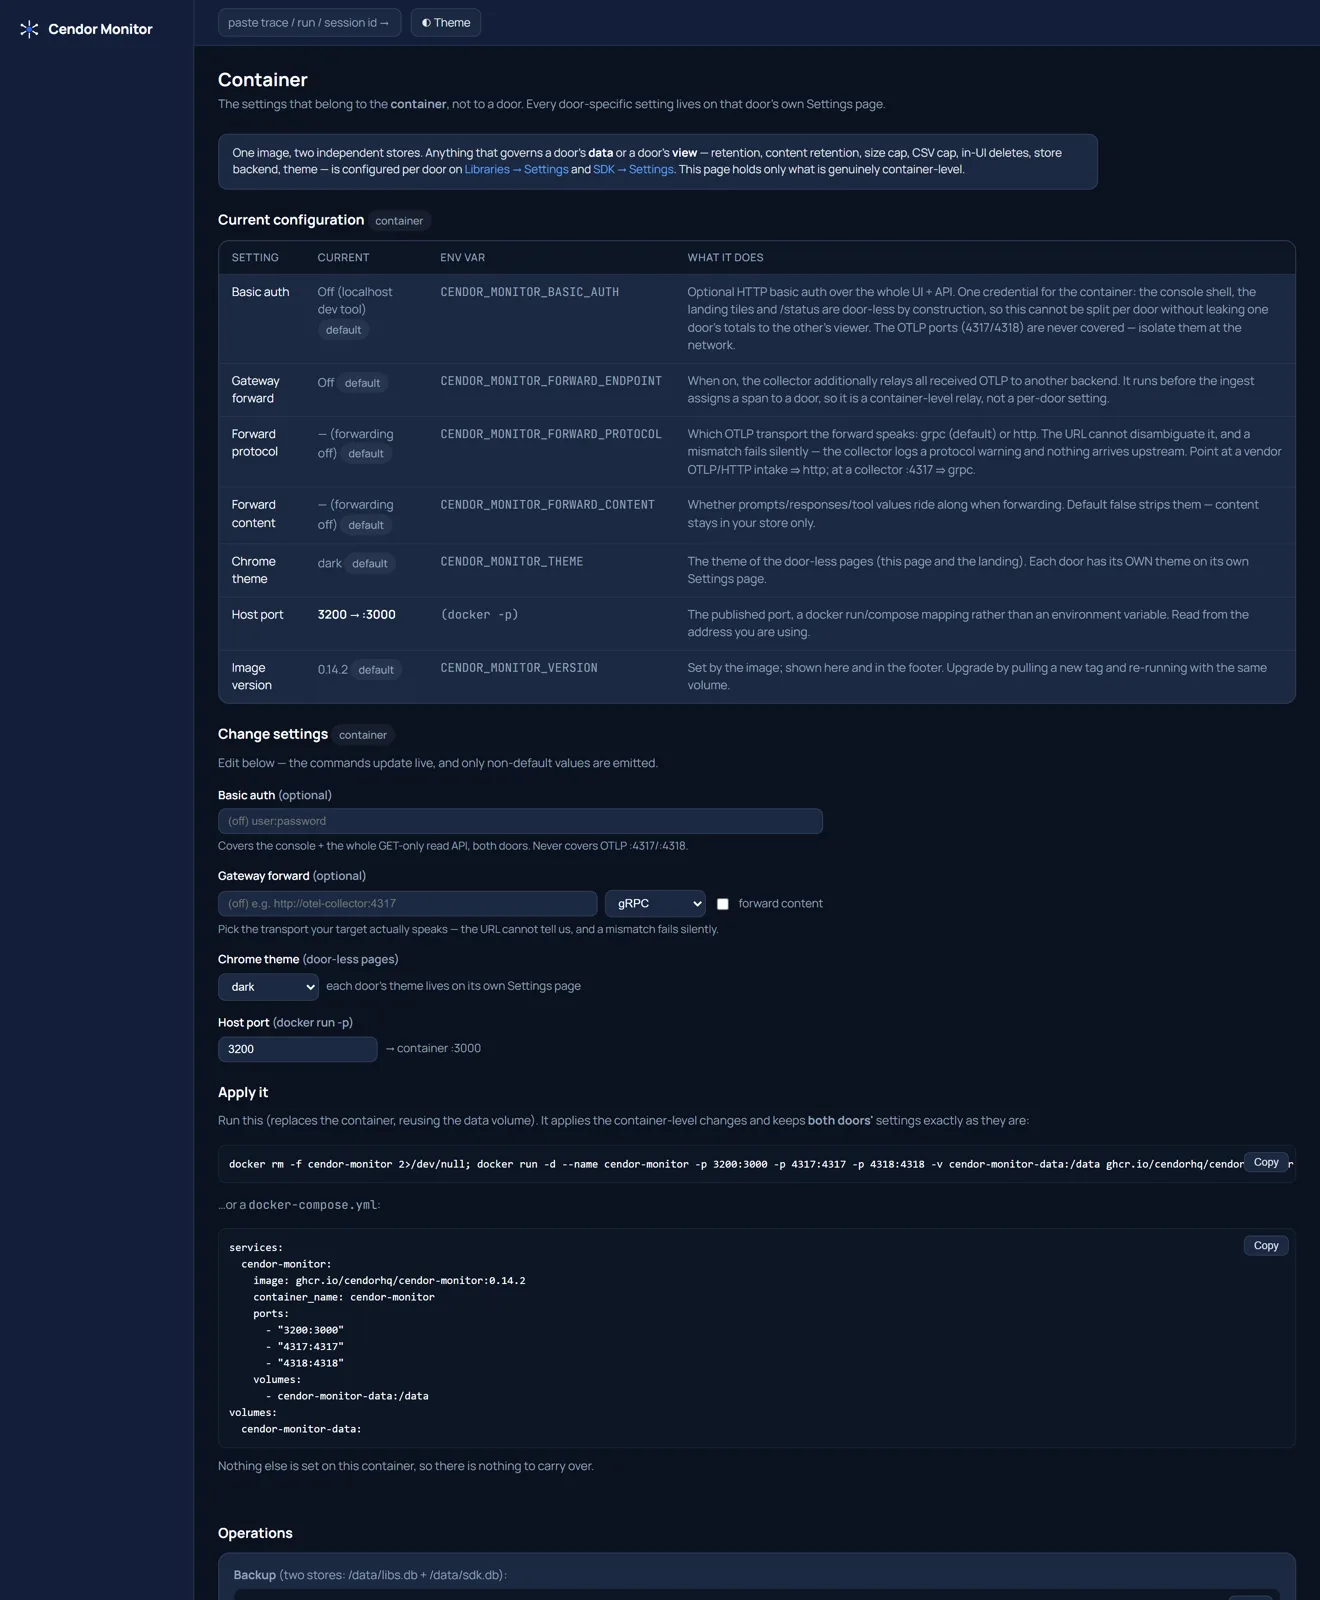
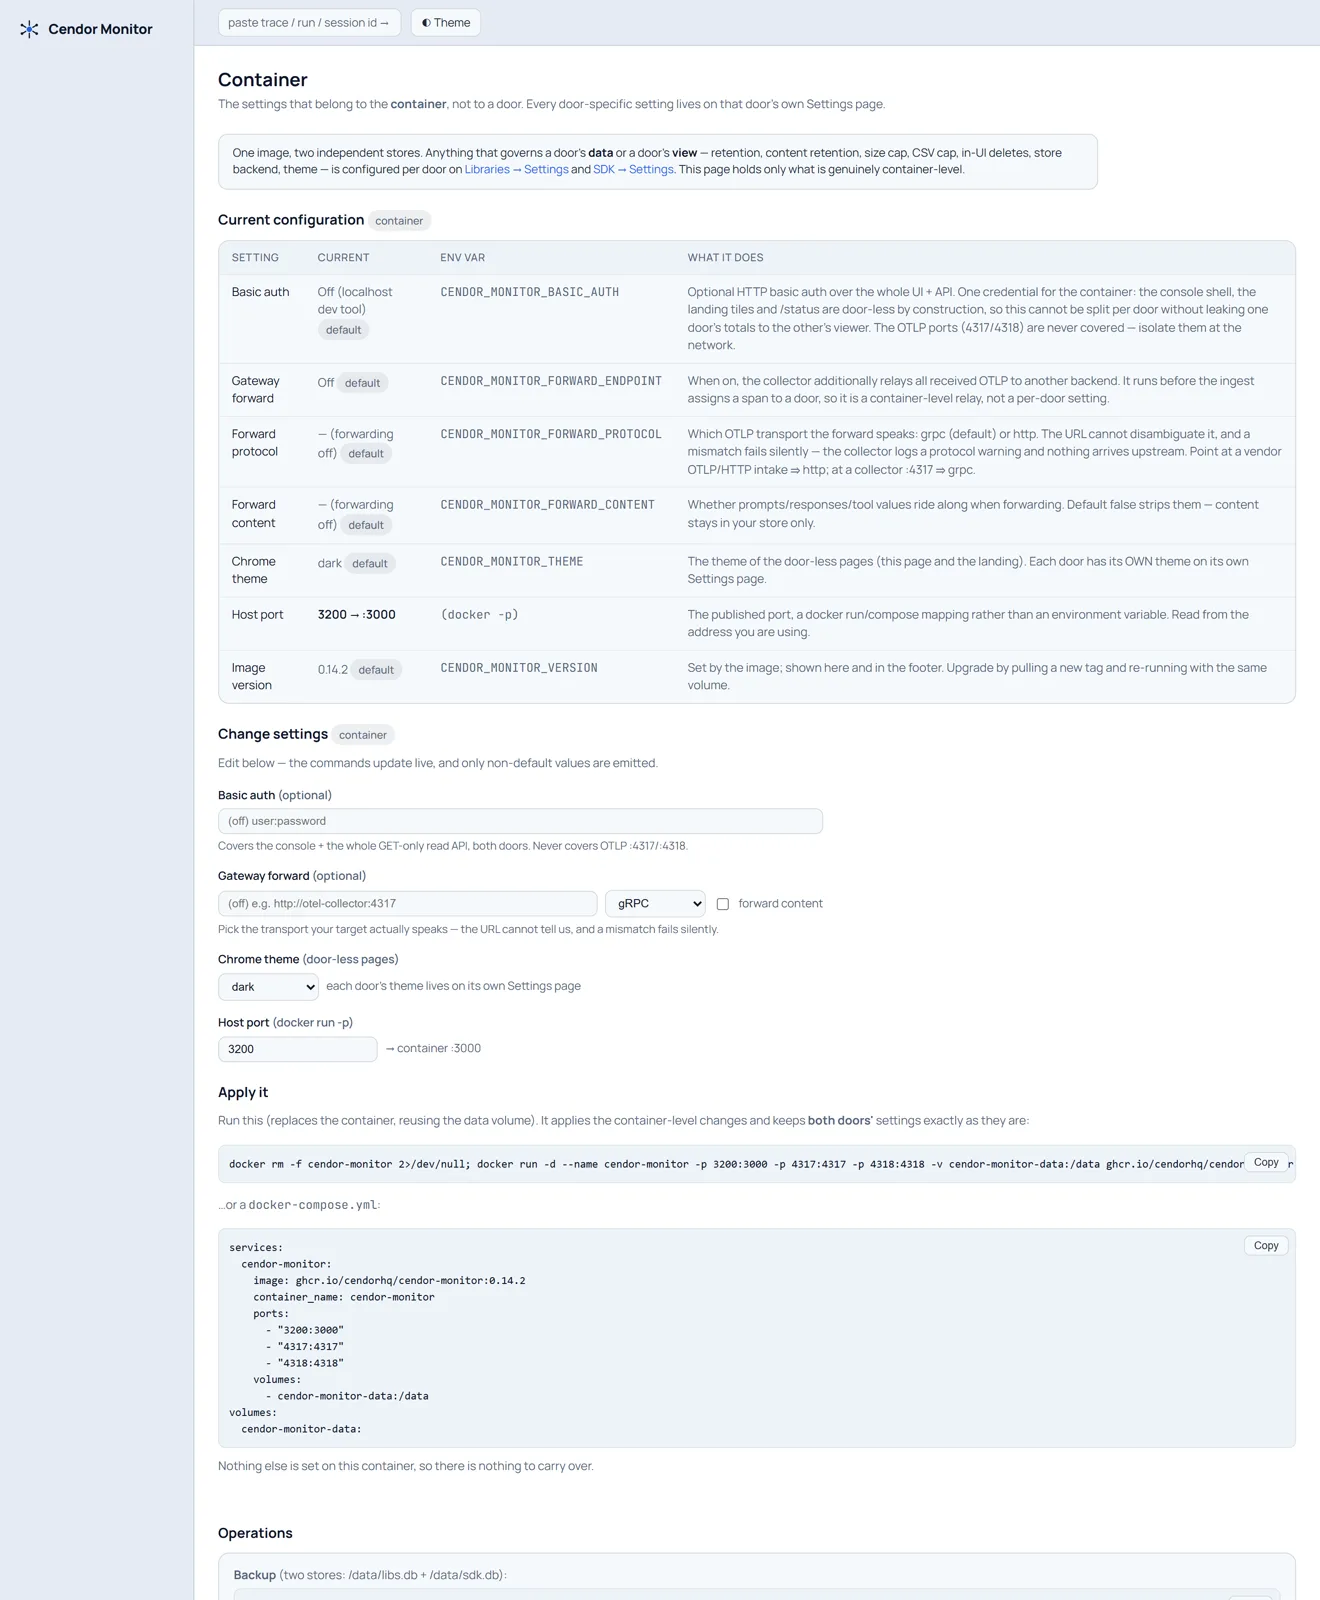
The settings that belong to the container rather than to either door — basic auth, the gateway forward, the host port, the chrome theme, backup and upgrade — plus a docker-run / compose builder and per-door status. Secrets (the Postgres DSN, auth password, forward URL) are never shown.
Watch the walkthrough
The whole loop in about two minutes — one docker run, a keyless governed run exports standard OpenTelemetry, and the journey view renders it. On your own machine.
60 seconds to a local monitor
Run the container, point your app's OpenTelemetry pipeline at it, open localhost:3000.
No login, no key: the image is public and multi-arch (linux/amd64 + linux/arm64). The libraries and the SDK need none of it — they emit standard OTLP to whatever backend you already have.
docker run --rm -p 3000:3000 -p 4317:4317 -p 4318:4318 -v cendor-monitor-data:/data ghcr.io/cendorhq/cendor-monitor:0.15.0export OTEL_EXPORTER_OTLP_ENDPOINT=http://localhost:4318
export OTEL_SERVICE_NAME=support-botThen attach the emitters you already know: use_sink(OTelSink()) (spend), live_spans() (trajectory), AuditLog(mirror=OTelMirror()) (governance). To see prompts/responses/thinking in the journey, opt in with otel.capture_content() (OFF by default). See the Cendor Monitor docs and the Observability guide. Use an embedded SQLite store by default, or point CENDOR_MONITOR_DB at Postgres for a team deploy. Set CENDOR_MONITOR_FORWARD_ENDPOINT and the same image doubles as a prod gateway (content stripped from the forward unless you opt in).
What it is — and what it isn't
| It is | It is not |
|---|---|
| A self-hosted monitor you run | A hosted Cendor service — Cendor never operates a telemetry endpoint |
| Standard OTLP in (one env var) | A Cendor-specific exporter, API, or key in your app |
| An operational copy of the audit stream | The evidence — verify() runs on the audit file, never on the monitor |
| Content only when you opt in (off by default) | A capture that the monitor turns on for you |
| Optional dev tooling — your own OTel backend stays the production default | A dependency of any library, or a replacement for your production backend |
An operational copy — not evidence
The governance views show an operational copy of your audit stream, for monitoring and alerting. The tamper-evident, hash-chained audit file on your app host is the only verifiable artifact — run verify() against that file. Nothing here is a "verified ✓" badge or a compliance attestation. And content lands only where your OTLP goes — Cendor never receives it. The screenshots above are from a real run: the monitor ships no sample app and fabricates nothing, so an empty console means nothing has been sent yet — not that it is broken.
Licensing — a permissive aggregate
The v0.15.0 image — the tag above — is Apache-2.0 (code) with OFL-1.1 fonts — every part is permissive, and there's no AGPL/GPL, so running it triggers no copyleft or source-disclosure obligation.
| Component | License |
|---|---|
| Cendor's monitor UI · ingest service · configs | Apache-2.0 |
| OpenTelemetry Collector (bundled) | Apache-2.0 |
| Node.js runtime | MIT |
| nginx | BSD-2-Clause |
| Manrope + JetBrains Mono (vendored fonts) | SIL OFL-1.1 |
Obligations are light — keep the bundled notices (shipped at /licenses, font texts at /licenses/fonts). The OFL fonts may not be sold on their own and must be renamed if you modify + redistribute them. Trademarks belong to their owners.