Cendor Monitor — watch your governed agents on your own machine
Cendor emits standard OpenTelemetry — one wire, no Cendor-specific exporter, never a Cendor endpoint. Where it goes is your choice: your own backend (Azure Monitor, CloudWatch, Datadog, Langfuse, any OTLP) for production fleets — or Cendor Monitor, a free, open-source, self-hosted journey view, when you want to see what your agents did and what each run cost in one screen: every prompt, token, dollar, and the exact step where a budget or guardrail acted. Same wire either way; switch or run both without touching code.
Two doors, and a window: the libraries and the SDK are how you build; Cendor Monitor is how you
watch. It is optional dev tooling (like cendor-mcp) —
no library depends on it, and your own OTel backend stays the documented production default. It runs
on your infrastructure; Cendor never operates a telemetry endpoint.
Run it in 60 seconds
One image — the OTel Collector, a small Cendor ingest service, a dual-backend store (SQLite by default), and the monitor. Run it, point your app’s OpenTelemetry at it, and open the monitor:
# 1. run the monitor (one image; SQLite by default — nothing else to install)
docker run --rm --name cendor-monitor -p 3000:3000 -p 4317:4317 -p 4318:4318 ghcr.io/cendorhq/cendor-monitor:0.15.0

# 2. point your app's OpenTelemetry pipeline at it
export OTEL_EXPORTER_OTLP_ENDPOINT=http://localhost:4318
export OTEL_SERVICE_NAME=my-app          # optional — names your app on the Apps page

# 3. open the monitor
#    http://localhost:3000
That is the whole integration — a standard OTLP env var, no Cendor API, key, or endpoint, and
no Cendor telemetry code: with an OpenTelemetry provider configured in your app (which the env var
above plus your usual SDK setup gives you), calls, run trees, spend and enforcement decisions all flow
on their own. Sessions group runs automatically when you pass run(session=…), so there is no trace id
to paste anywhere. Requires cendor-core ≥ 1.13 / @cendor/core ≥ 0.15 (+ cendor-sdk ≥ 1.19 /
@cendor/sdk ≥ 0.22); on older versions attach the emitters explicitly, as
Observability describes. Nothing arriving? CENDOR_DEBUG_TELEMETRY=1 prints one
line telling you whether a provider was detected — and CENDOR_TELEMETRY=off is the way to stop
sending, with no code change.
The monitor tour
The monitor is a self-contained view over the same standard wire — no query language, no dashboard to
assemble. Screenshots are of the real monitor rendering one real governed run (a keyless,
reproducible refunds-triage workload with content capture opted in for it) — the image itself
ships no sample app and fabricates nothing: every screen you see is fed by your own runs, and an
empty store just means nothing has been sent yet, not that something is broken. (The shots are of
the current v0.14.2 console — the same tag the docker run above pulls — so the two doors, the
Container page, the agent dimension and the verdicts-first governance stream are all visible in
them.)
Overview
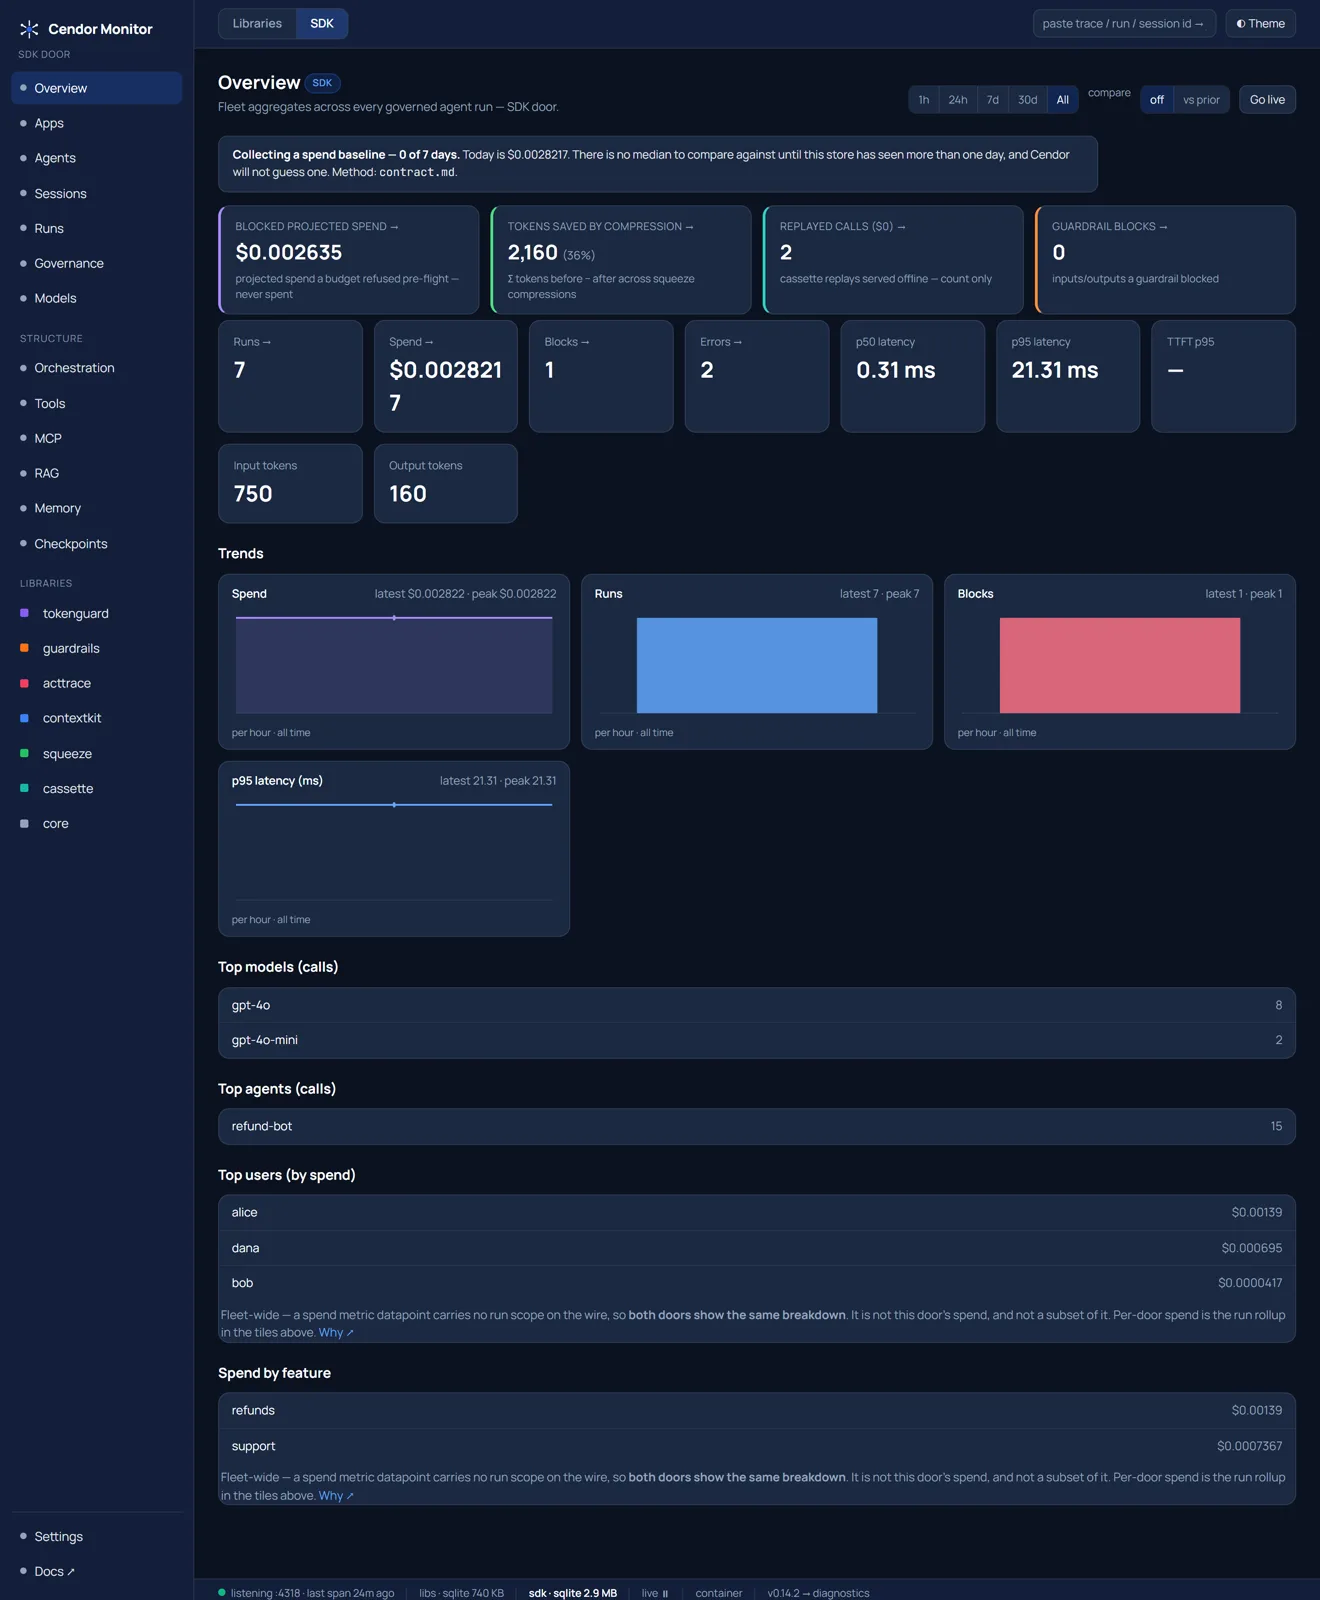
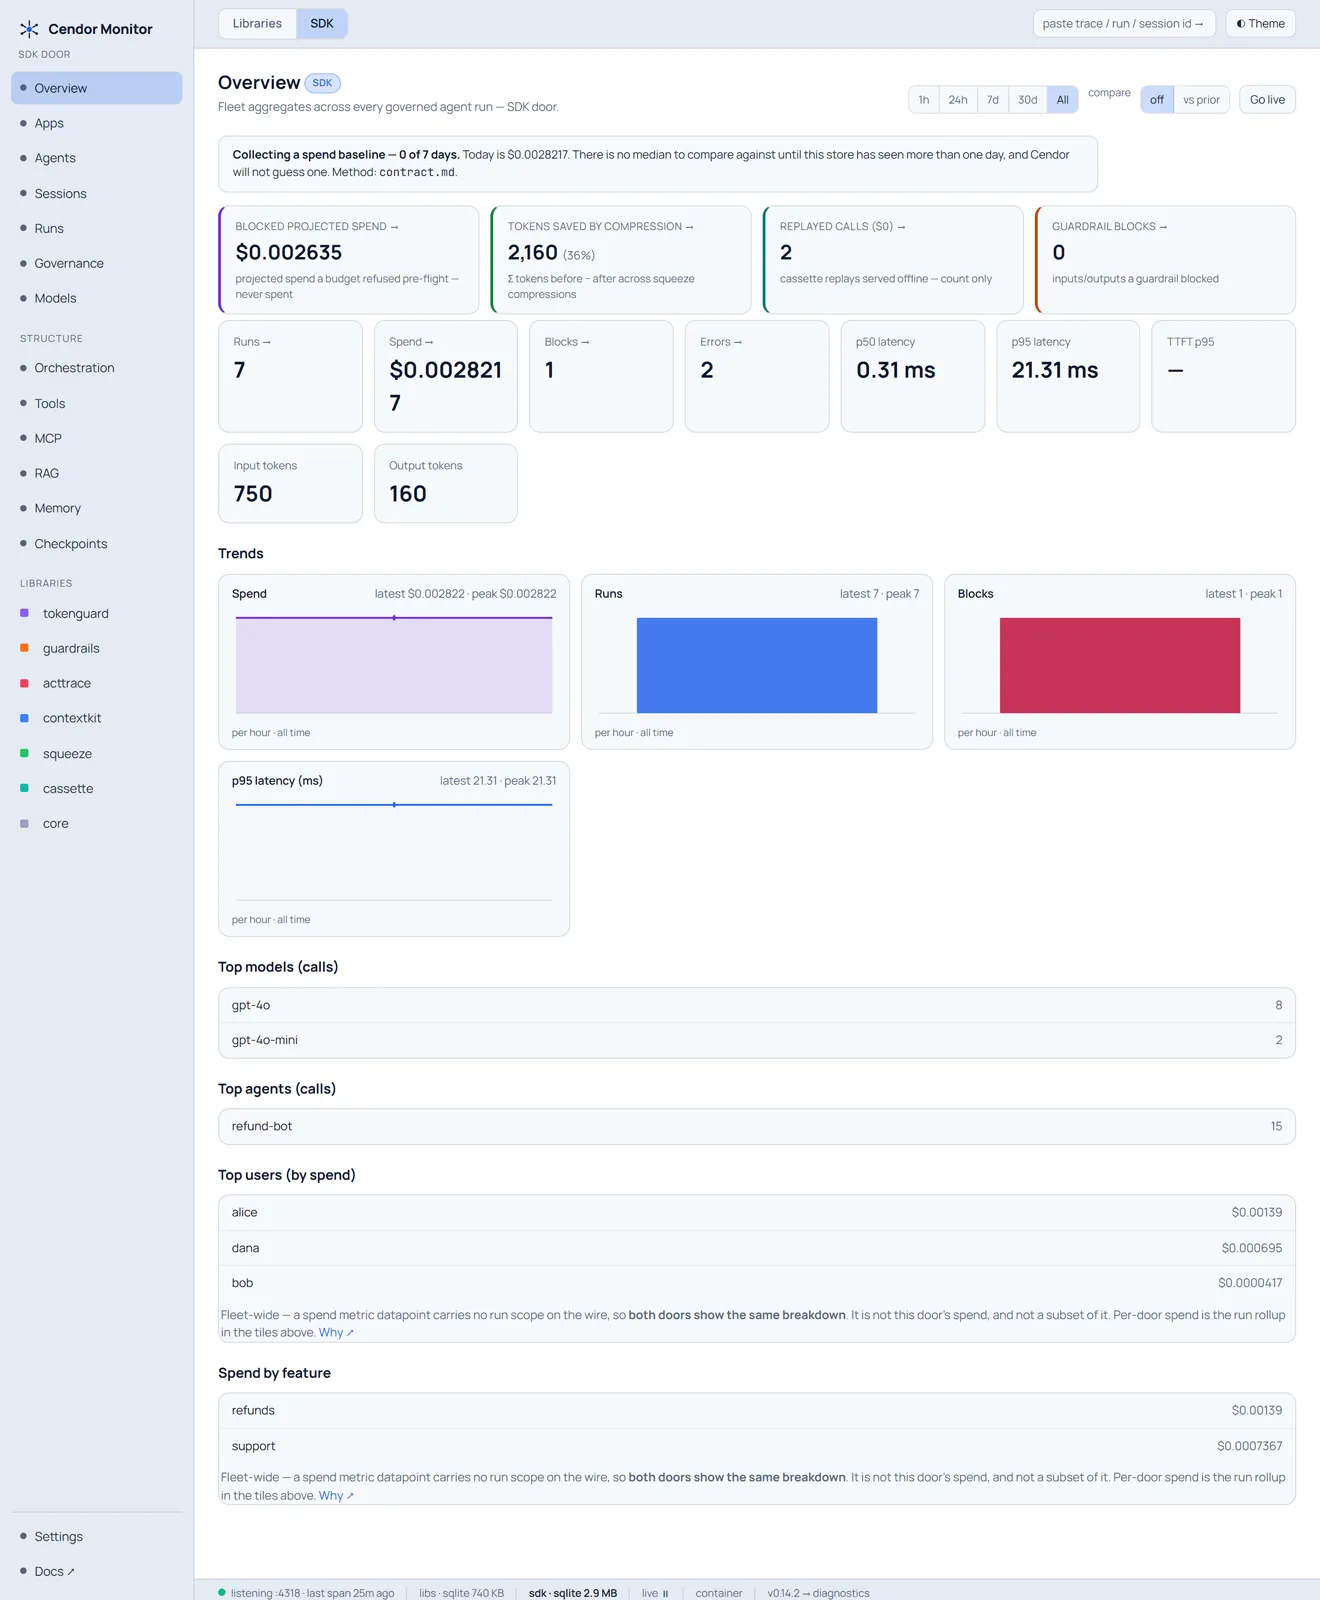
Land on the Overview: the Cendor value strip — blocked projected spend (the projection a budget refused pre-flight — never spent), tokens saved by compression (Σ before − after, +%), replayed calls ($0) (a count, not an invented dollar-saving), and guardrail blocks — above the fleet tiles (runs, spend, blocks, errors, p50/p95, TTFT), dependency-free trend charts, and cost attribution: top models, top agents, top users by spend, and spend by feature. A time-range row (1h/24h/7d/30d/all) and a Go live toggle sit up top; every tile clicks through to its rows.
Agents → Sessions → Runs
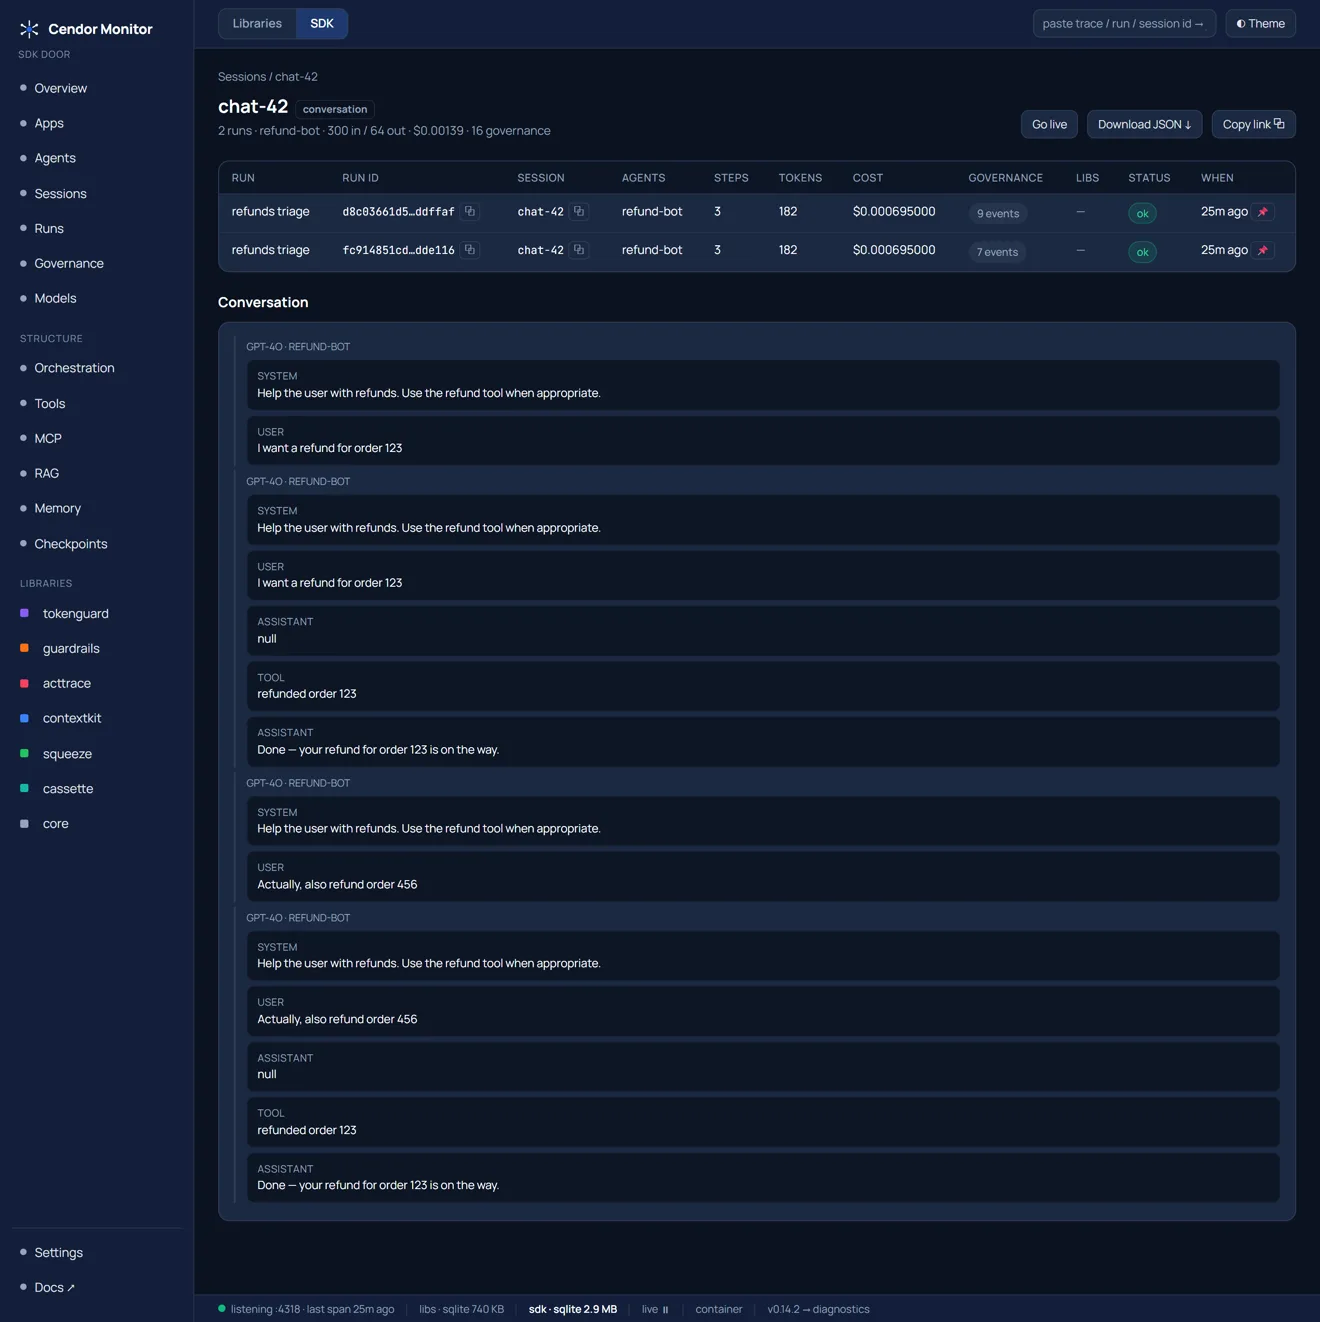
Drill from an agent to its sessions to the runs inside them — the drill-down is built from the auto
gen_ai.conversation.id your SDK stamps from run(session=…). A session’s rollup header + stitched
conversation thread across its runs:
The run journey — with governance inline
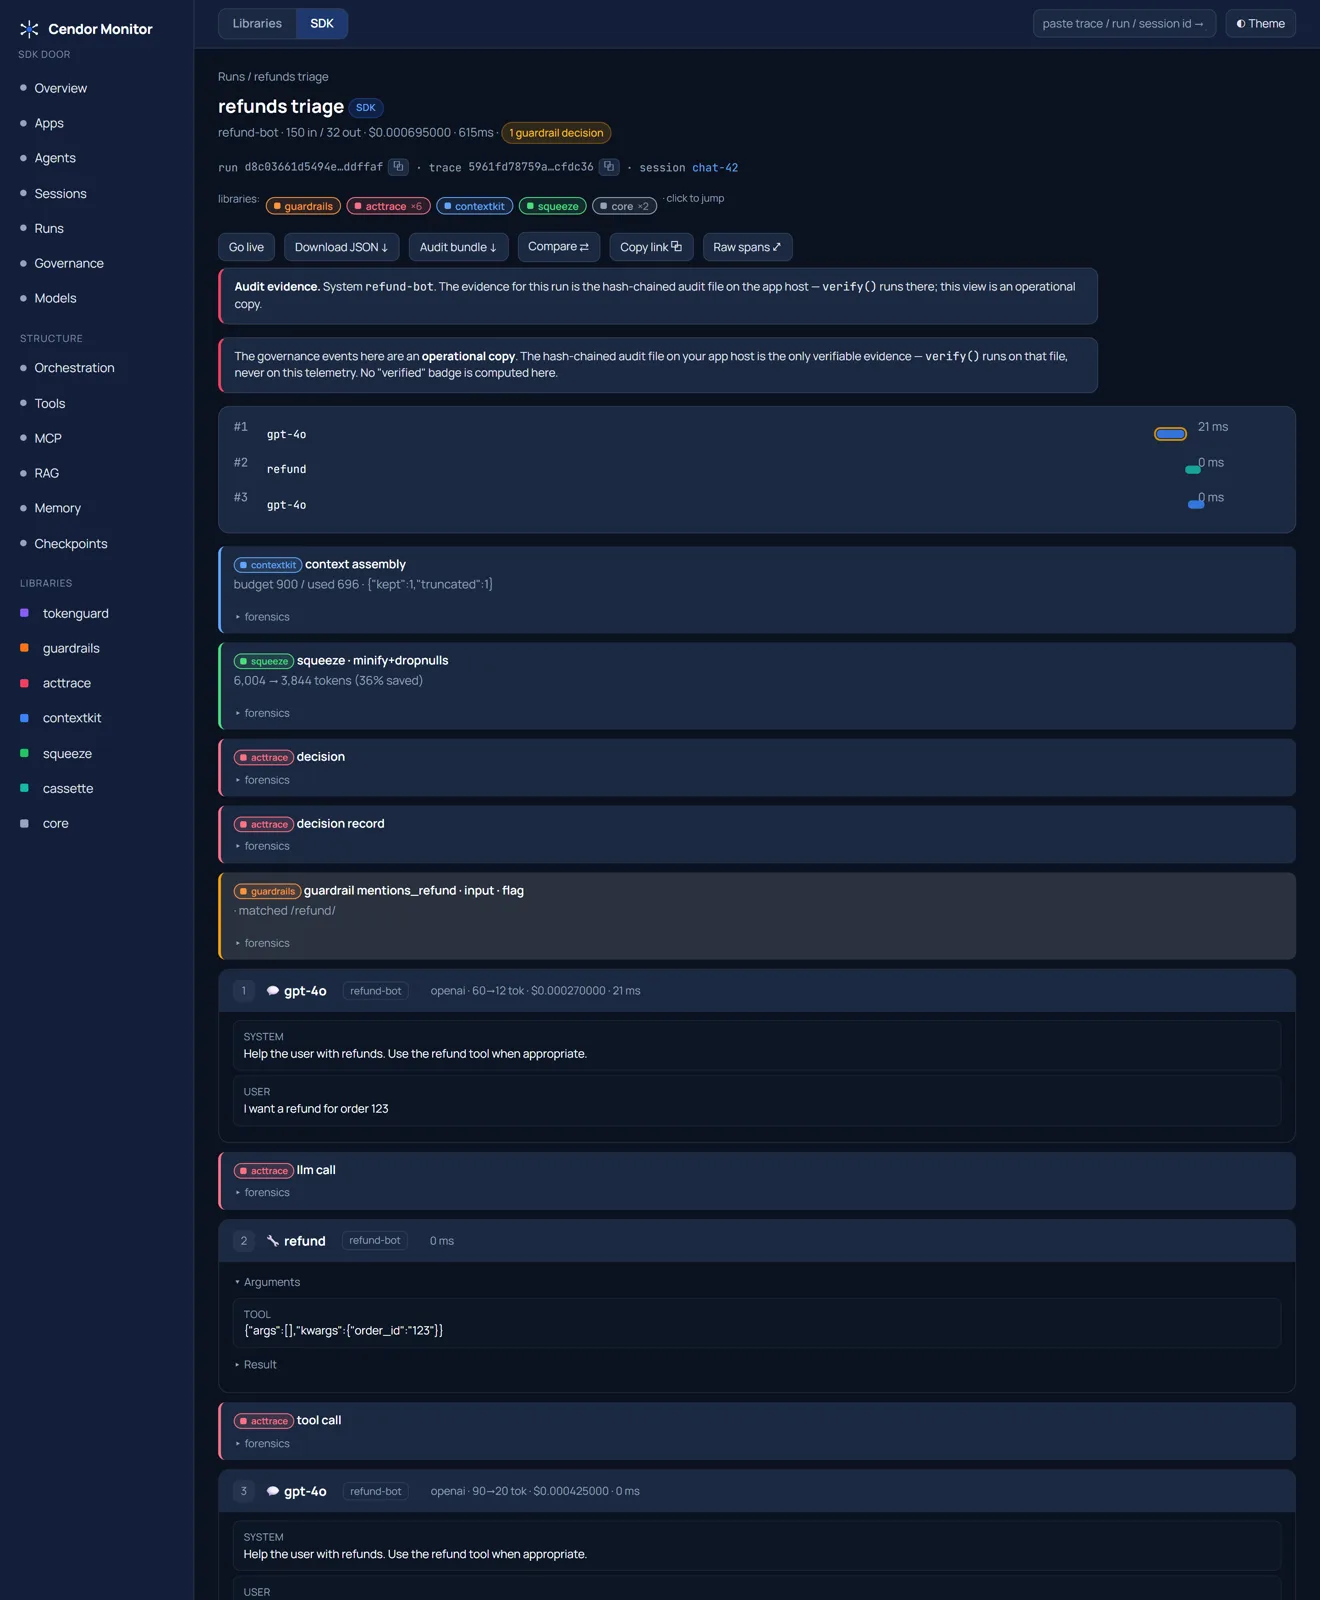
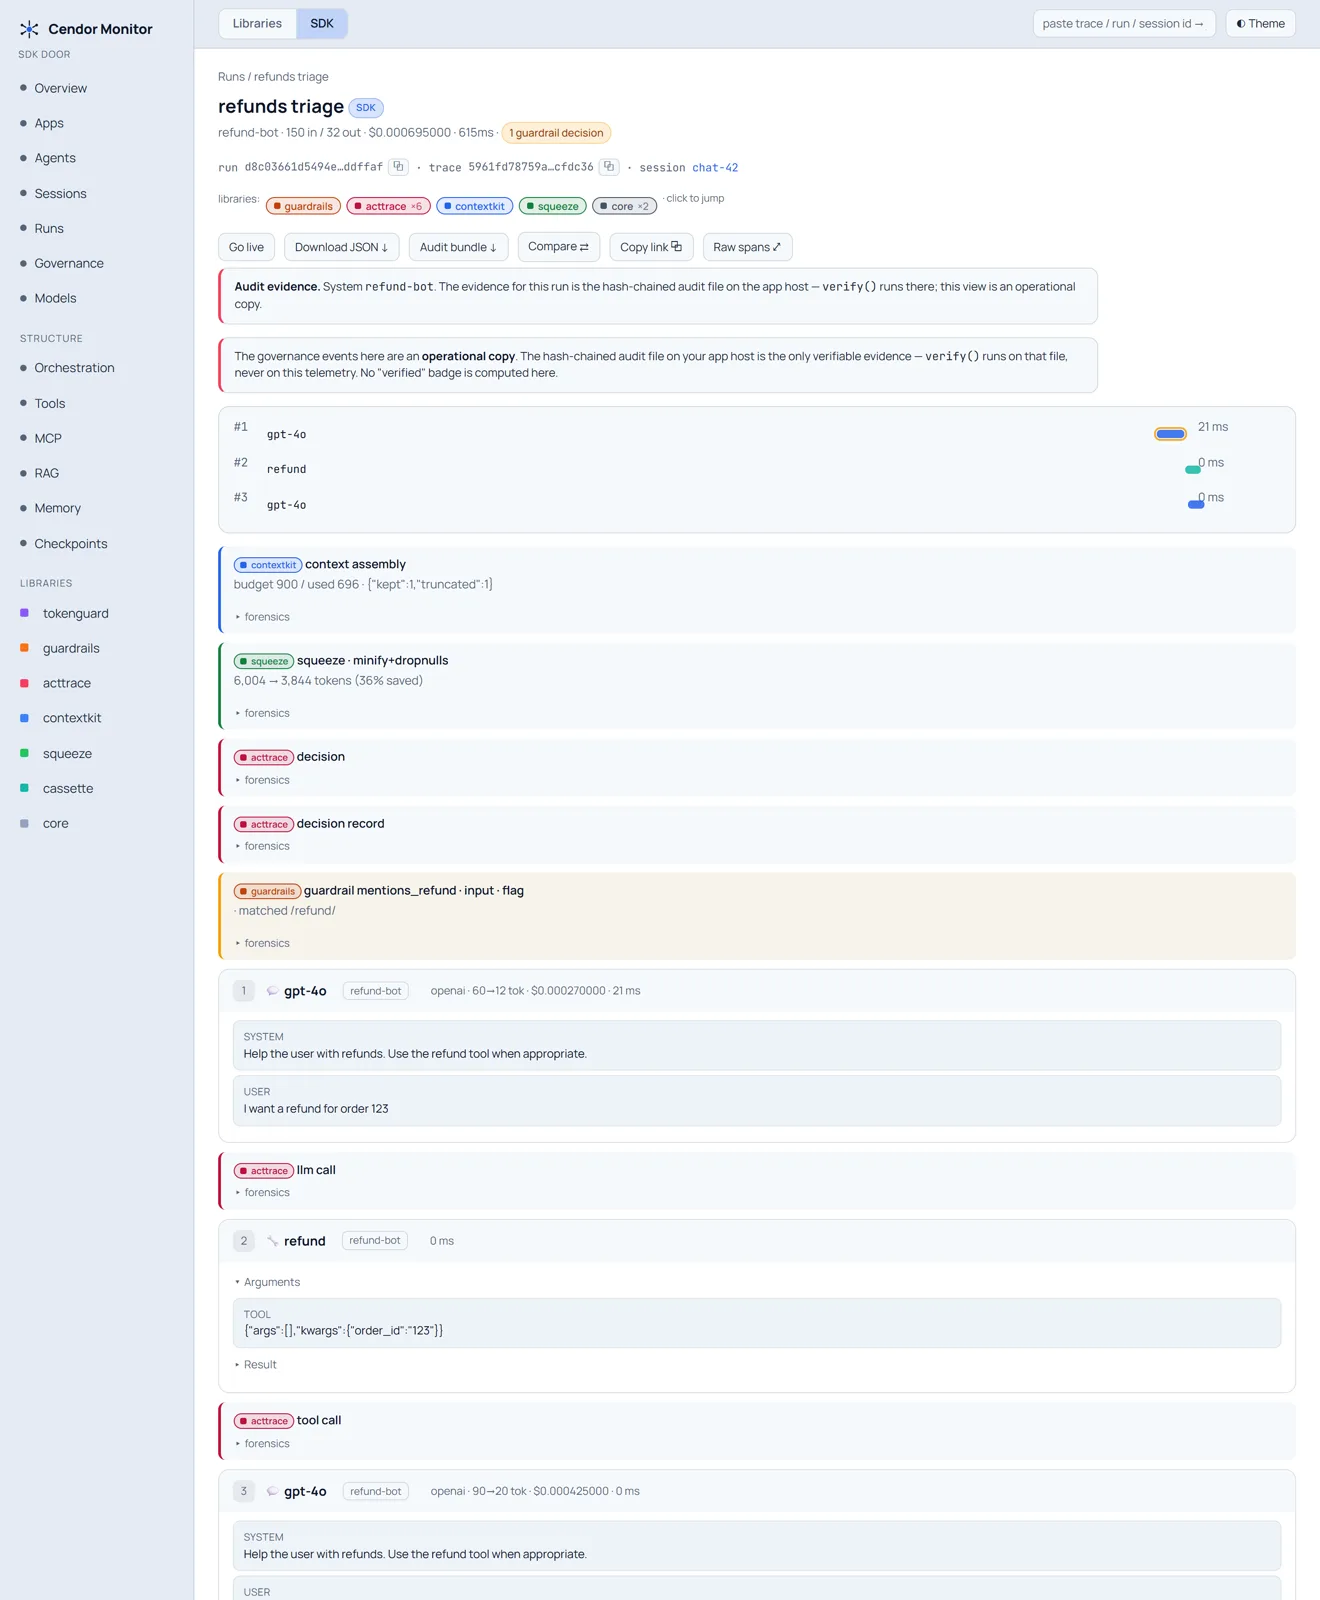
The differentiator: the whole conversation for a run — system / user / assistant / thinking / tool arguments and results — with tokens, cost, latency, and time-to-first-token per step, and the exact step where a budget block, guardrail verdict, or compression fired, shown inline in the conversation (not in a separate log). Prompt/response content appears only if you opted in (below); without it, the journey shows the same structure metadata-only.
Governance events link back to the run that produced them — a governed run correlates its whole trail
to the run’s trace (the run root is the active span; automatic since cendor-sdk 1.19 / @cendor/sdk
0.22, or inside an explicit live_spans() / liveSpans with sdk ≥ 1.12 / 0.17), and a run built
post-hoc from span_tree still links by run id. So a run’s governance count is never a dead end: open
the run and every verdict sits on the step it governed.
You get governance without writing any governance code. A budget block or guardrail verdict arrives
as a governance.* span (cendor.gov.* attributes) and renders in the same Governance board and the
same inline run verdicts. If you do keep an AuditLog, its mirrored audit.* entries take over
(richer: chained, hashed, sequenced) and the ops spans stand down, so nothing is shown twice. Either
way the board is an operational copy — the hash-chained file on your host is the only thing
verify() checks.
Two doors: SDK runs and libs-only calls (v0.9 — two stores, two modes)
The monitor renders two doors, because the two ways to use Cendor put different amounts of
identity on the wire — the truth is identical, the shape isn’t. A run under cendor-sdk
(live_spans() / span_tree(), scope cendor.sdk) carries an agent.run root, so it gets the full
run ▸ session ▸ agent hierarchy. A libs-only app (you called instrument() and
use_span_emitter() yourself, scope cendor.core) emits flat governed calls with no run root —
tokens, cost, and governance are all there (the row rolls them up from its own steps), but there is no
session/agent hierarchy, by design. The split adds no wire attribute — it reads the OTel
instrumentation-scope name already on every span. Same wire, richer identity: an sdk run is never
“more governed” than a libs call.
v0.9 makes the split first-class. Each door is its own store (/data/libs.db + /data/sdk.db,
or point either at Postgres — mixed mode is supported), and the console has two full UX modes with
the door in the URL (/libs/…, /sdk/… — real routes, so two browser tabs can watch two doors at
once). A persistent Libraries | SDK switcher swaps the whole surface; single-door installs never
see it. The Libraries mode is Overview · Calls · Governance · Models + the seven proof pages (no
agent/session vocabulary). The SDK mode adds Apps · Agents · Sessions · Runs and a Structure
group — Orchestration (a per-run agent-handoff graph + a fleet flow map), Tools (per-tool
invocations, error/block rate, local vs mcp), MCP (servers seen + per-server attribution),
RAG, Memory, and Checkpoints — all rendered from the structural cendor.sdk spans the SDK
emits (cendor-sdk ≥ 1.16 / @cendor/sdk ≥ 0.21). A slim status footer shows the honest ingest truth
(“listening :4318 · last span 12s ago”, never “app connected”), each door’s store backend + size, and
the image version. Go Live streams updates over Server-Sent Events (live steps, not live tokens);
it falls back to polling automatically. Fresh v0.9 stores start empty — there is no migration from
a pre-v0.9 single store (a dev-phase breaking change; the old volume is left untouched).
The Libraries door in v0.12.3–v0.14.0 — call groups, the agent dimension, and an honest money table
Four measured gaps closed, all on the door that had the least identity to work with:
- A call group is real now. With cendor-core ≥ 1.14 /
@cendor/core≥ 0.16,core.trace("id")opens a real parent span, so a scope over N calls arrives as one row withSTEPS = N— the scope id leads the Calls list (agroupchip, the models beside it) and the detail heading reads Run instead of Call. Before those versions the scope only stamped an id, so the same code produced N unrelated rows; the console’s own advice pointed at a lever that could not move. It is still a call group, not a session: the Libraries door gains no agent-or-session hierarchy from it. - The agent dimension appears when your framework provided one. Cendor ships three framework adapters whose whole purpose is to attach an agent name to a libs-door call, and the console used to answer “the Libraries door has no agents” even when the store held one. There is now an Agents (from your framework) page, an Agent column and an agent filter — shown only when the store actually contains an agent, with the provenance stated on the page. A plain libs app still sees no agent vocabulary, and Sessions stays SDK-only.
gen_ai.agent.id, when you have one. The Agents page shows the id as a chip beside the name, so two agents that share a name across apps no longer collapse into one row and a rename no longer loses that agent’s history. Absent, nothing is shown — never a hash, never a placeholder.- The cost-attribution caveat. A spend metric datapoint carries no run scope on the wire, so
both stores receive every datapoint and both doors show the same fleet-wide breakdown. Measured at
one instant: the libs attribution table totalled
$0.0257against a libs run rollup of$0.0628— neither the door’s spend nor a subset of it. That limit is real and cannot be fixed by splitting the table; what was missing was the console saying so, which it now does under every spend list. Per-door spend is the run rollup in the tiles above it.
Governance you can read (v0.13.0)
The audit stream carries two different things and nine spellings of about five outcomes. Both are now addressed on the Governance page:
- One word per outcome.
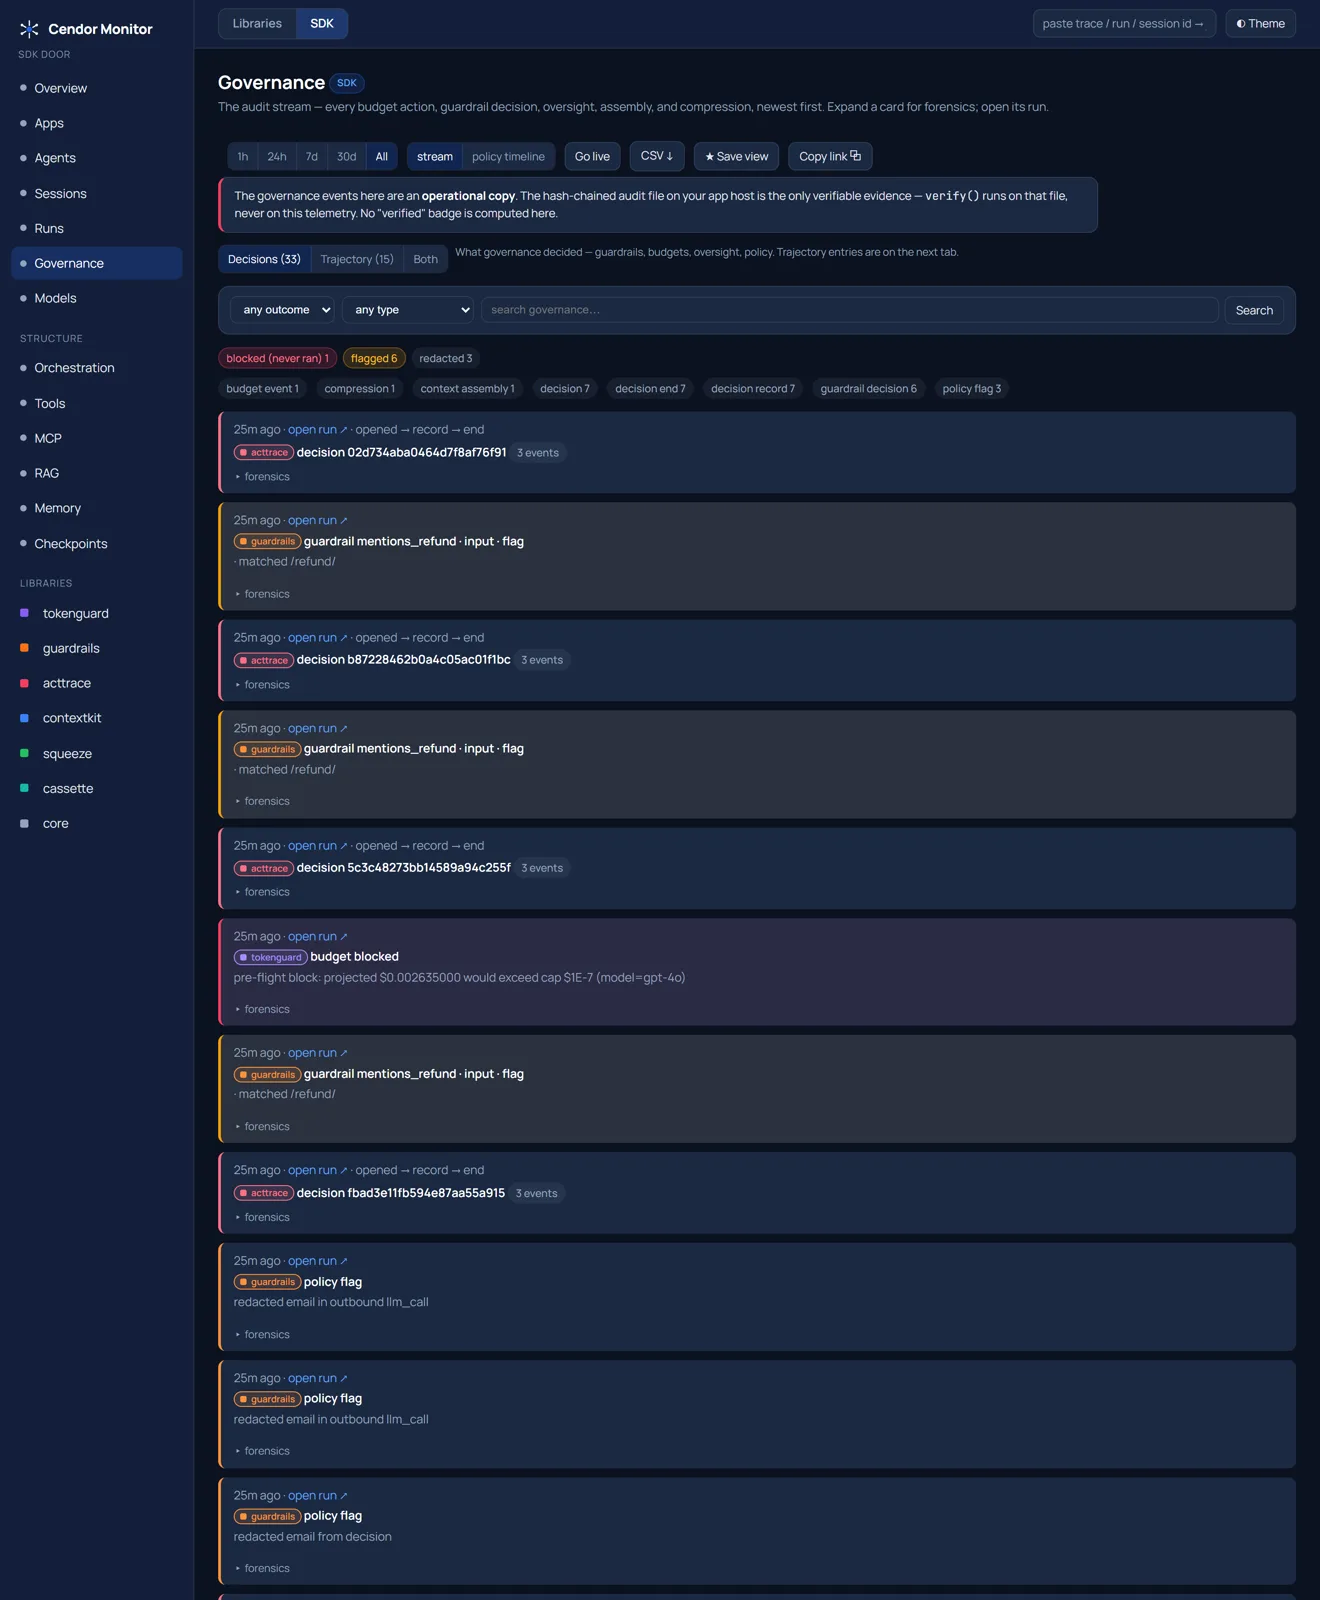
action_class=block|break|clamp|flag|redactfolds the raw values, because the libraries name one concept differently per event type (budget_event.blockedvsguardrail_decision.block;policy_flag.redactedvsredact) — so a single-select rawaction=could never answer “show me the blocks”.human_oversight.rejectedsits in block (a human stopping an action stops it), andbroken— a mid-streamon_exceed="break"— is its own outcome because the call did run. The rawaction=filter is still there for power users. - Verdicts before trajectory.
llm_call/tool_callare audit trajectory entries, not verdicts, and they made up 62–71 % of a measured stream. The page defaults to Decisions; Trajectory is one click away, and each tab shows the other’s count. - One decision, one row.
decision+decision_record+decision_endcollapse bydecision_id. - A blocked run looks like the product working. A zero-step run with a blocking verdict reads
blocked before any call; one without is mutedno steps recorded. 11 of 27 measured zero-step runs were pre-flight blocks and looked exactly like noise. - The mirror-completeness hint stops crying wolf.
seqis the audit file’s counter, shared by every run appended to that chain — and one chain per process is the recommended shape — so it warns only when a run’s own range is internally gapped, all its events share one audit system, and the run is that chain’s first.
Apps — the libs door’s top level (v0.8)
The libs door gets a top-level entity of its own, symmetric with the SDK door’s Agents page: the
Apps page groups every run by its OTel resource service.name. Each app card rolls up runs,
tokens, spend, governance, errors, and a distinct-instance count (from service.instance.id, the
standard OTel per-process id) — click through to that app’s runs. This answers the “what contains all
of a libs-only app’s runs?” question in-standard: an app’s identity is its own OTel resource, not
anything Cendor invents. Set it with one env var and zero code:
OTEL_SERVICE_NAME=billing-bot # (and optionally OTEL_RESOURCE_ATTRIBUTES=service.instance.id=…)Runs with no service.name group under an unnamed app card that teaches exactly this fix. Nothing
new on the wire — service.name was already stored on every run row; v0.8 makes it an entity and adds
the nullable instance_id column (an additive, zero-loss schema upgrade).
Proof pages + the governance stream
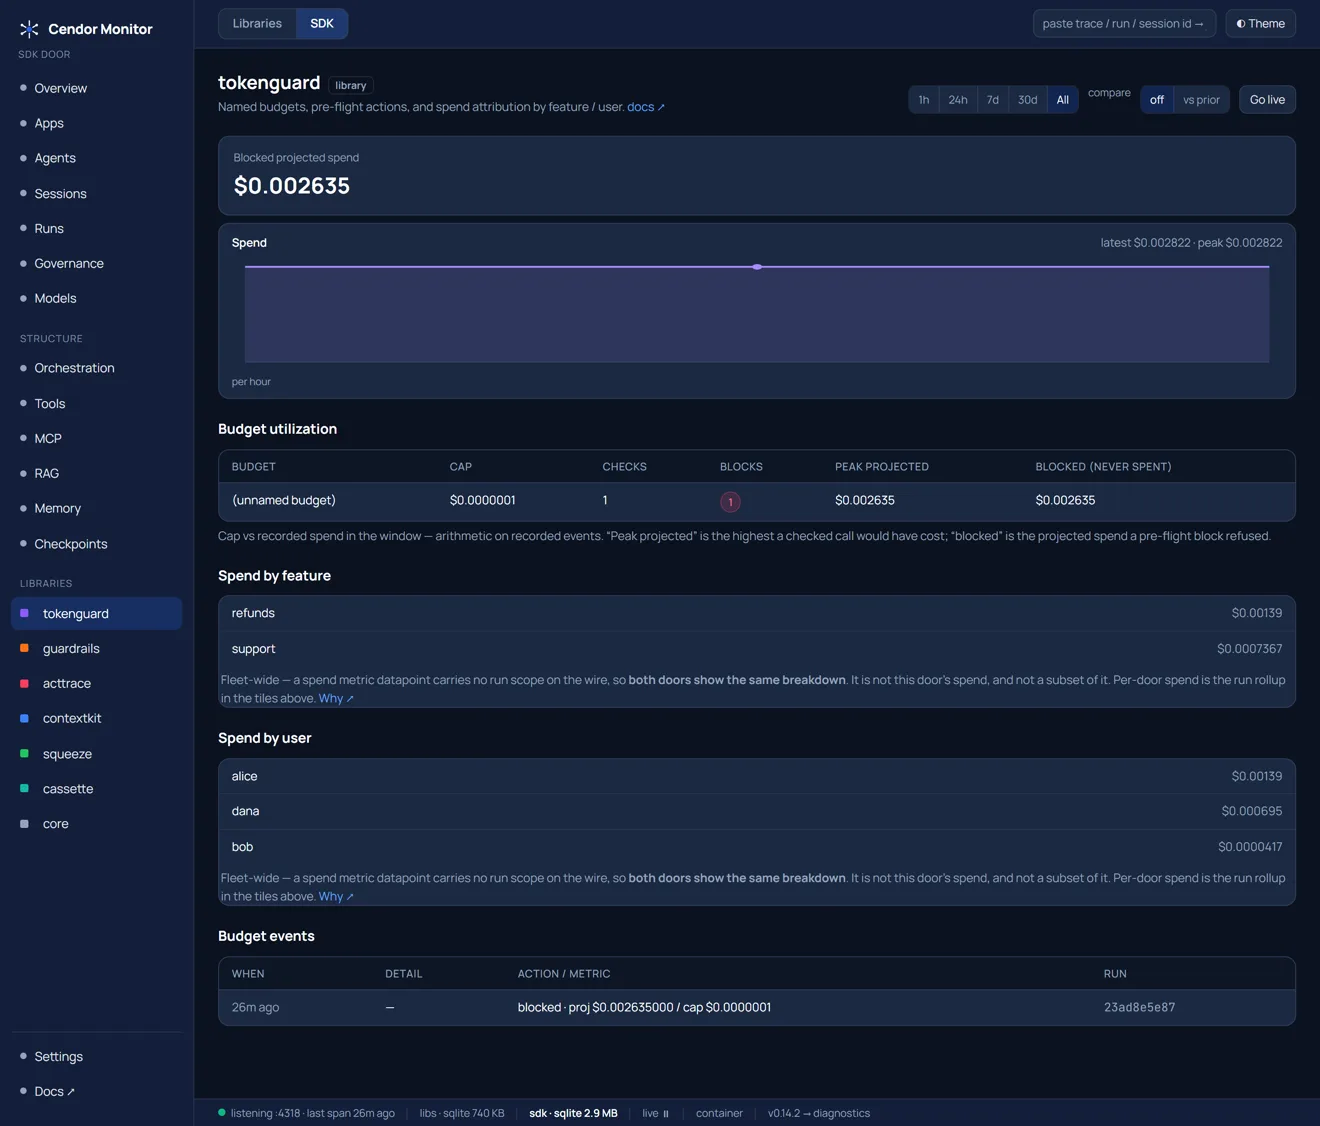
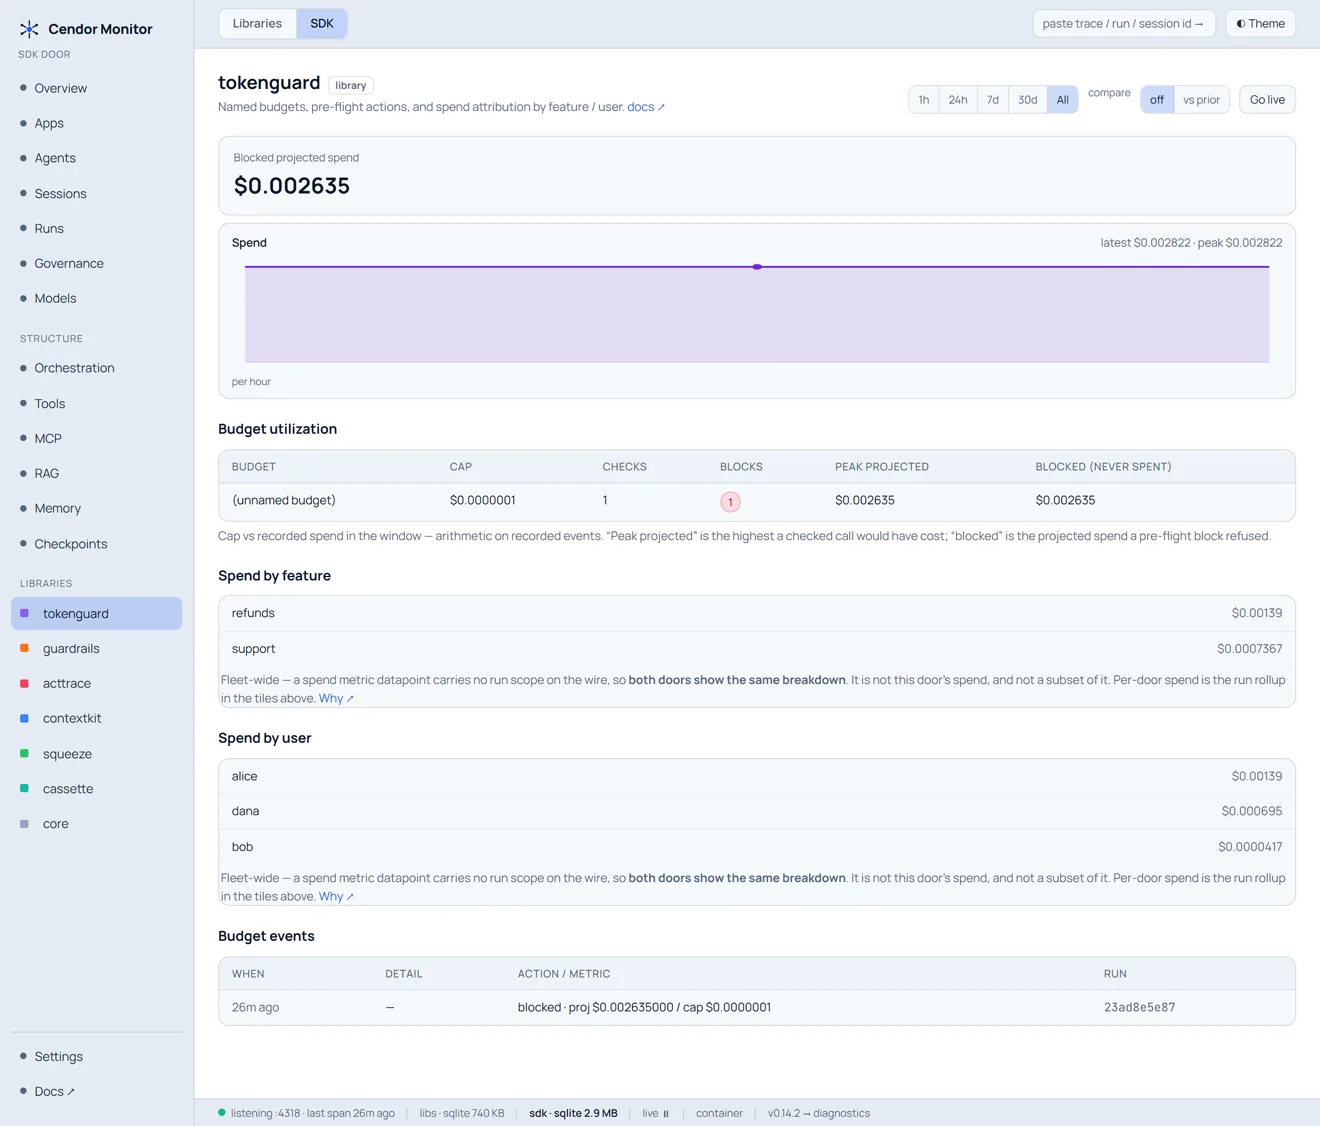
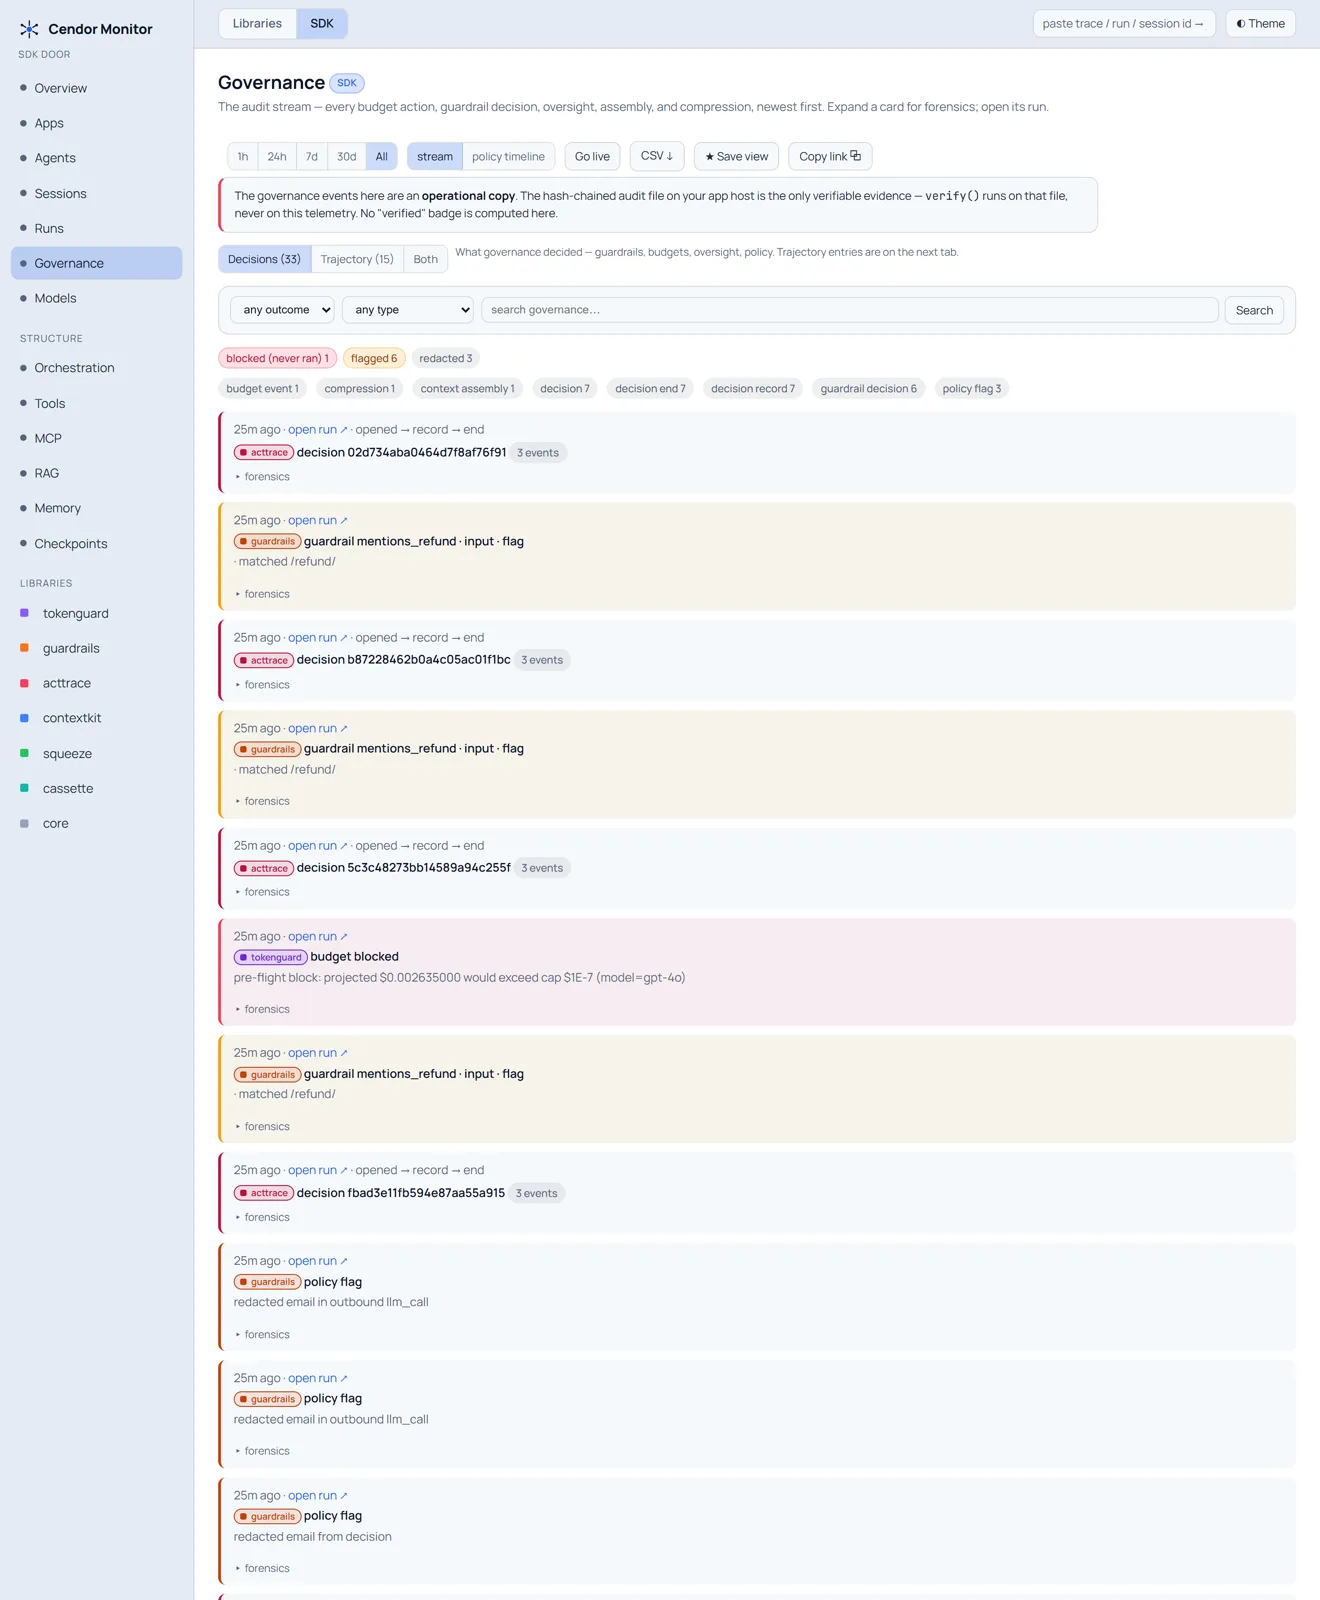
A per-library proof page for each of the seven libraries turns the monitor into proof of the libraries — each with a trend chart, a value tile, and the raw event table. tokenguard’s page shows spend attributed by feature and by user plus a blocked-projected-spend tile and the budget-events table (which budget blocked what — projected vs cap); squeeze’s shows compression events with before/after tokens. The Governance page is a typed, filterable stream of every decision, budget event, and guardrail action.
Filter, search, and go live
The Runs, Sessions, and Governance lists share a filter bar — facet dropdowns (agent / model / service / label or type), a free-text box, a time-range preset, sort, and paging, all deep-linked in the URL. The free-text box has a scope toggle: meta filters the metadata, content runs a real indexed full-text search — but only over what you opted to store (nothing when content capture is off). A live toggle (off by default) polls every few seconds and pauses on a hidden tab.
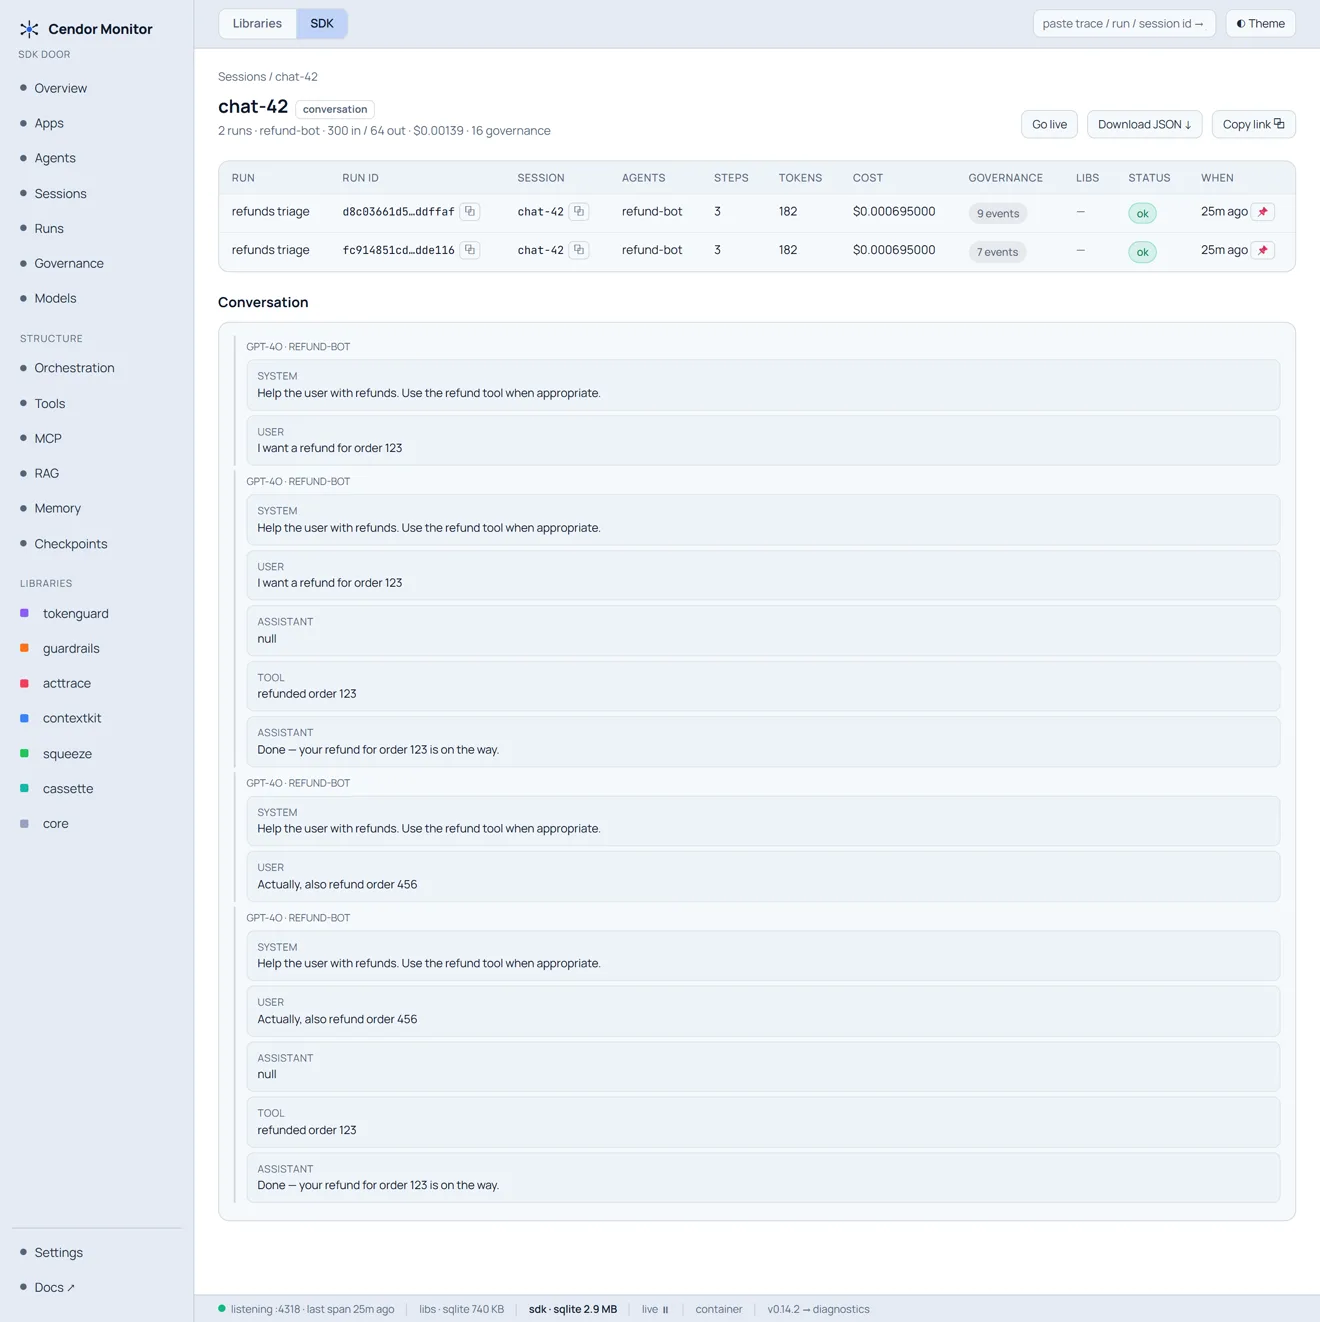
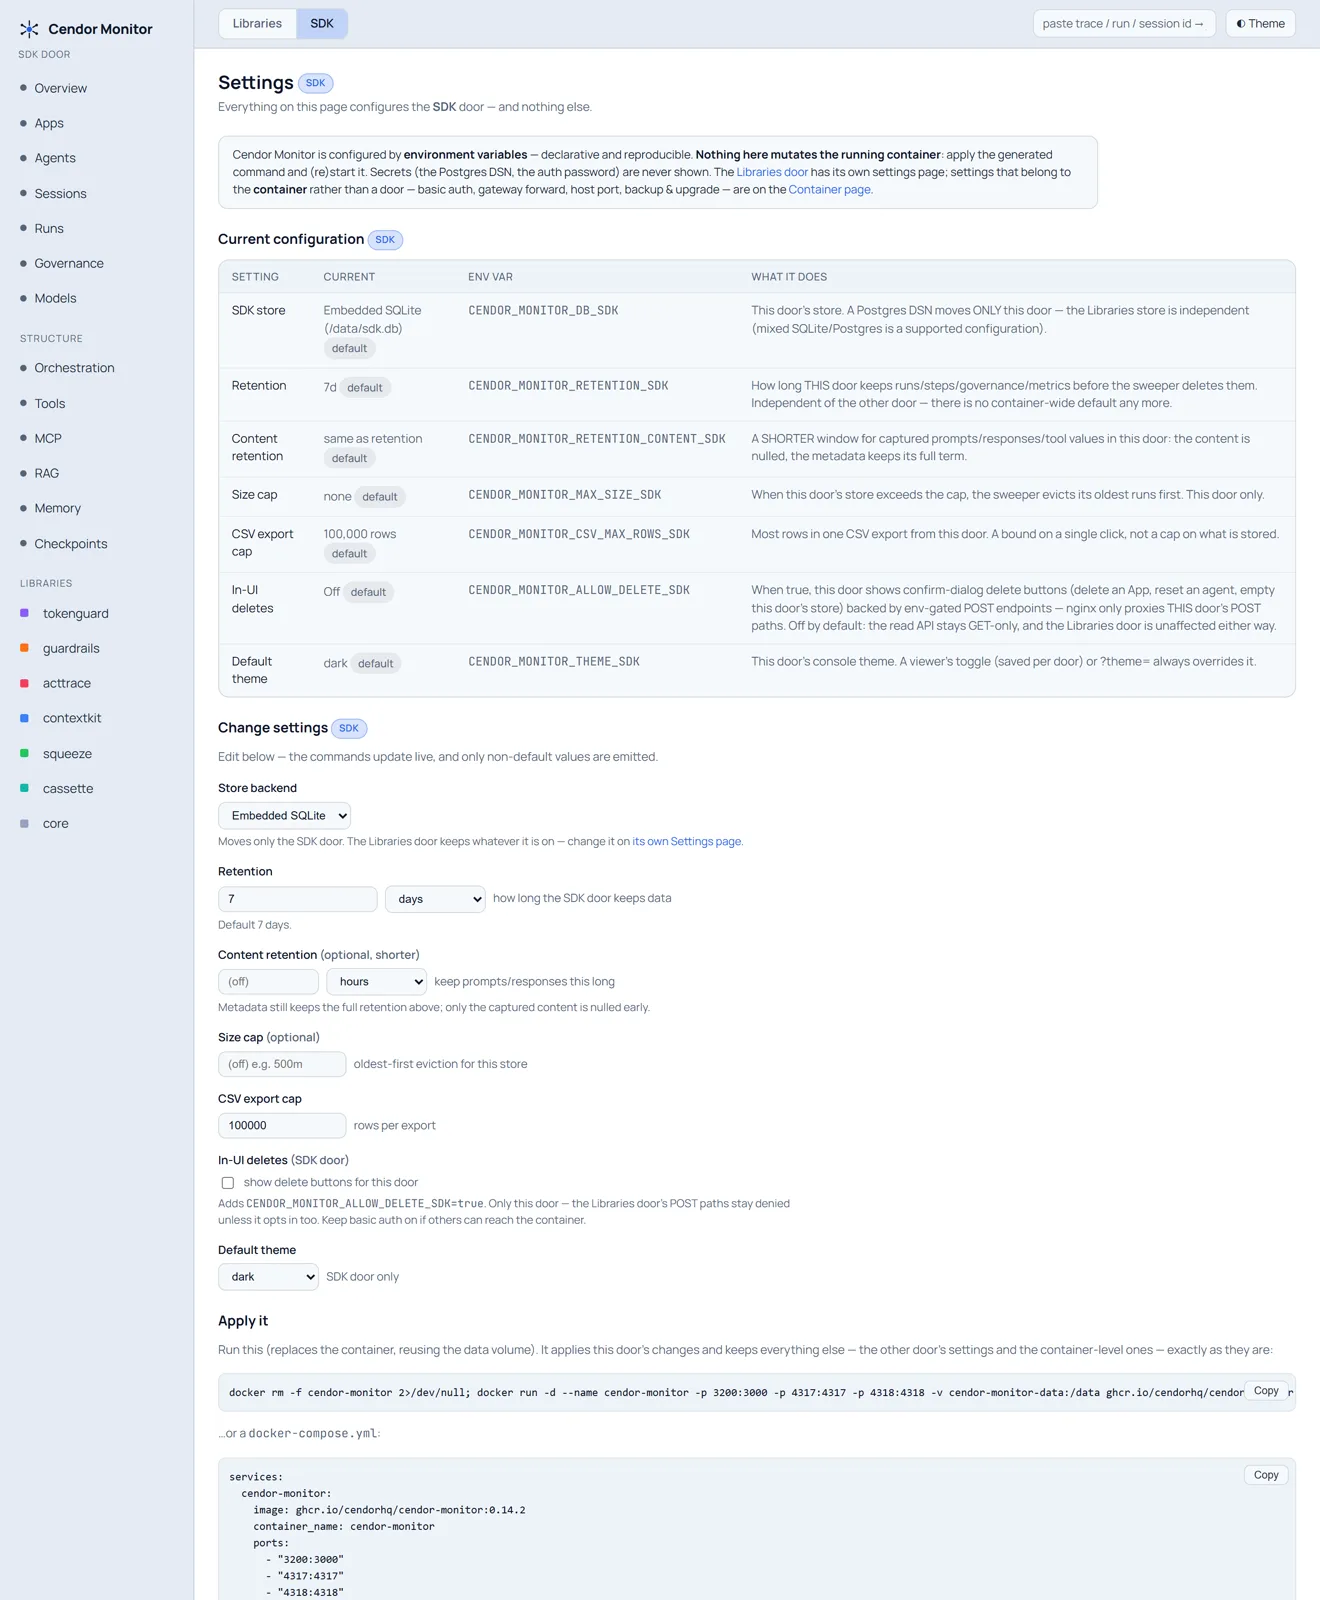
(The screenshots above follow your theme — dark or light. Cendor Monitor ships both.)
Turn on content capture (opt-in)
By default the monitor shows structure — models, tokens, cost, latency, governance verdicts — but not message content. Prompts, responses, thinking, and tool values are captured only if you turn them on, in your app, with one call (or the standard env var). The monitor never enables it for you.
from cendor.core import otel

# Opt in. A mask scrubs each message list before export (fail-closed if it raises);
# max_bytes caps each attribute (a truncation marker is appended when hit).
otel.capture_content(mask=lambda msgs: msgs, max_bytes=8192)

# Or set the standard env var instead of code config:
#   OTEL_INSTRUMENTATION_GENAI_CAPTURE_MESSAGE_CONTENT=true
import { otel } from '@cendor/core';
// Opt in. `mask` scrubs each message list before export (fail-closed if it throws);
// `maxBytes` caps each attribute (a truncation marker is appended when hit).
otel.captureContent({ mask: (msgs) => msgs, maxBytes: 8192 });
// Or set the standard env var instead of code:
// OTEL_INSTRUMENTATION_GENAI_CAPTURE_MESSAGE_CONTENT=trueWhere content lands: your store volume only (or your Postgres). In gateway mode (below), the
container strips content attributes by default when forwarding upstream — you opt in again with
CENDOR_MONITOR_FORWARD_CONTENT=true. Content never enters the acttrace evidence chain or its
OTelMirror — audit.* stays content-free, and you delete captured content on your own retention
schedule. See content capture.
Configuration
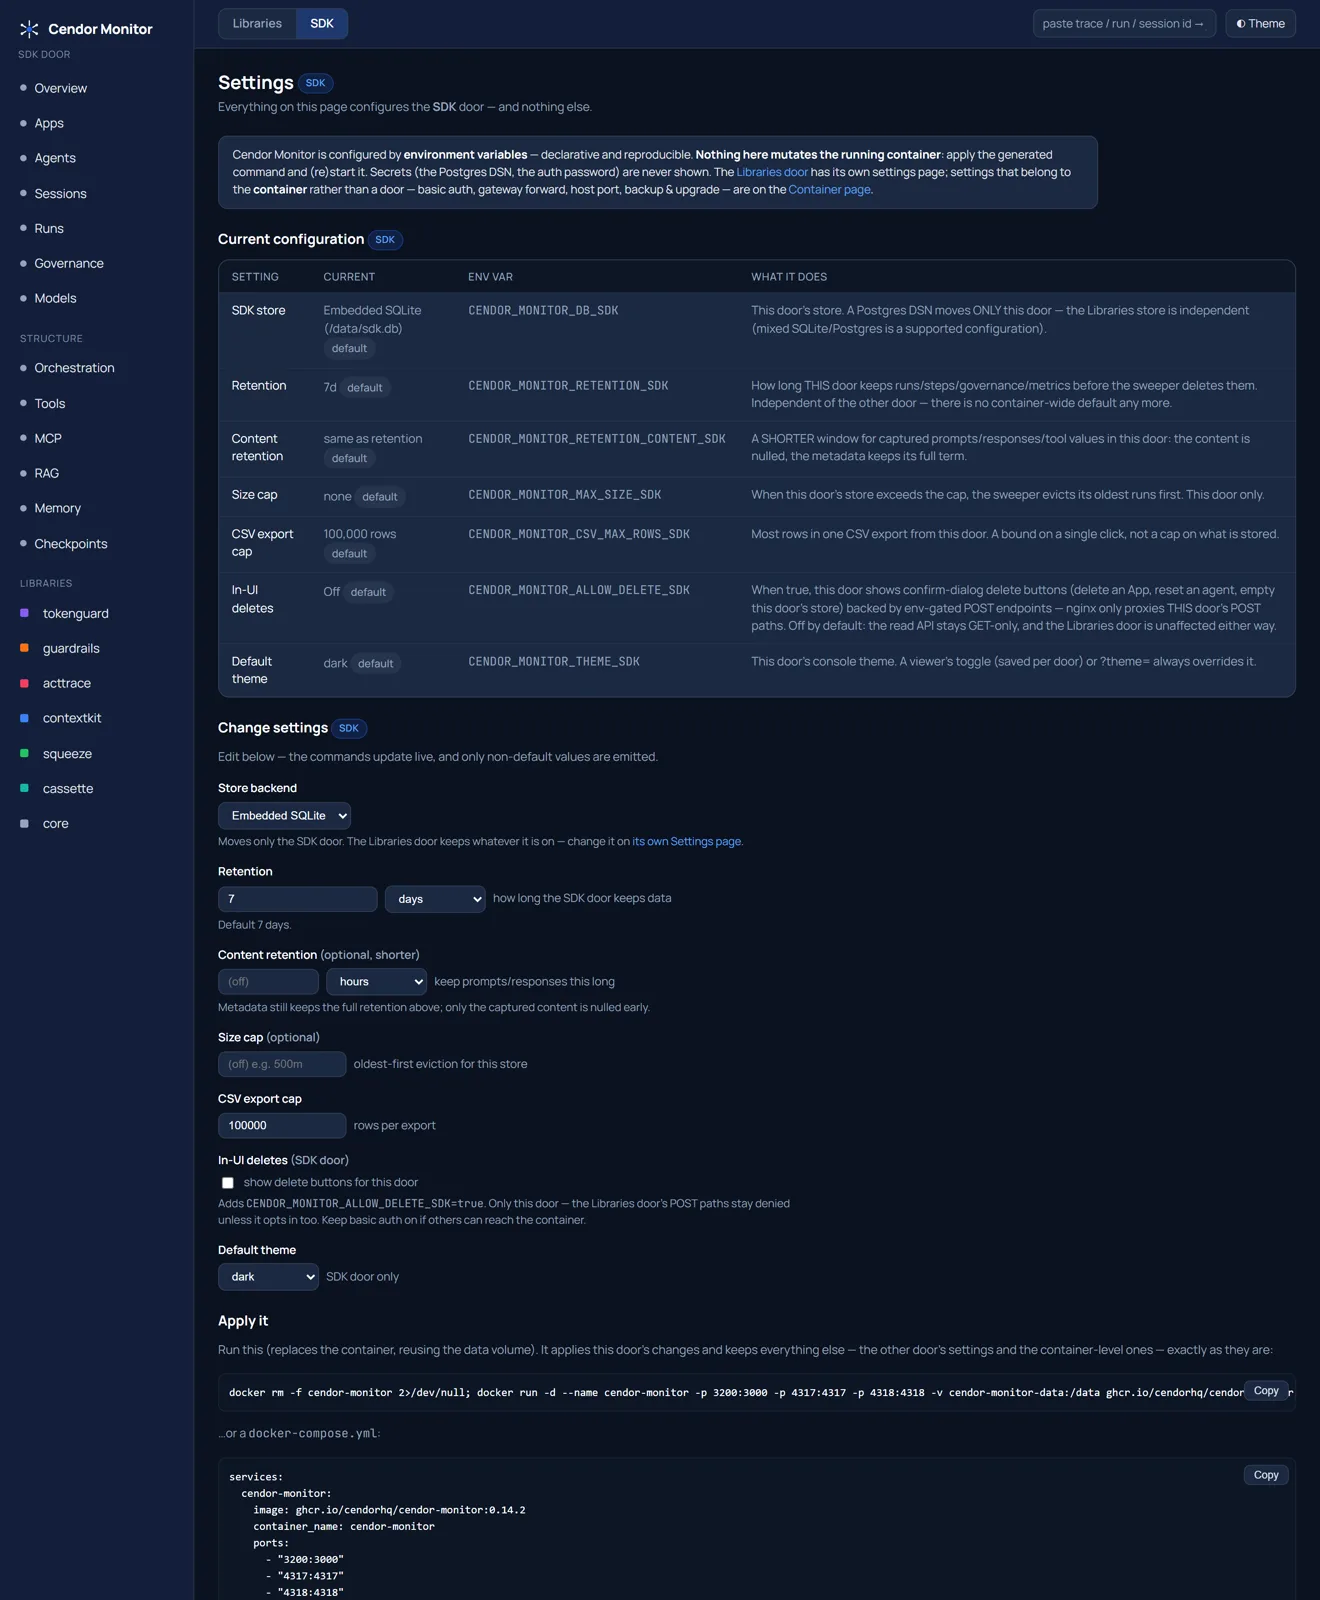
The container is configured entirely through environment variables — no config files to mount. The
monitor reads a safe subset at boot (default theme, retention, storage backend type, whether forward
/ auth are on) — never the Postgres DSN, the auth password, or the forward URL. The Settings page
shows the effective config and builds the exact docker run / compose command to change it:
| Variable | Default | What it does |
|---|---|---|
| Since v0.10.0 the two doors are configured independently: anything that governs a door’s data or | ||
its view exists once per door (…_LIBS / …_SDK, no container-wide fallback) and appears only on | ||
| that door’s Settings page; the handful of settings that govern the container itself live on the | ||
| door-less Container page. Pre-v0.10.0 container-wide names were removed — the container maps a legacy | ||
| value forward onto both doors and logs a deprecation warning, so nothing changes silently on upgrade. |
| Variable | Default | What it does |
|---|---|---|
OTEL_EXPORTER_OTLP_ENDPOINT | — | Set in your app, not the container — http://localhost:4318. The whole integration. |
CENDOR_MONITOR_DB_LIBS / _DB_SDK | (unset → embedded SQLite) | Per door. External Postgres DSN (postgres://…, ≥ 14) for that door; unset ⇒ embedded SQLite (WAL) on /data. Mixed mode (one door Postgres, one SQLite) is first-class. One image; Postgres is never bundled. Read from env only, never logged. |
CENDOR_MONITOR_RETENTION_LIBS / _SDK | 7d each | Per door. An ingest-side sweeper deletes that door’s runs/steps/governance/metrics older than its own window (both backends). |
CENDOR_MONITOR_RETENTION_CONTENT_LIBS / _SDK | (unset) | Per door. Optional shorter window for the opt-in content columns only — drops that door’s prompts/responses sooner than its metadata, which lives its full term. |
CENDOR_MONITOR_MAX_SIZE_LIBS / _SDK | (unset) | Per door. Size cap (e.g. 500m, 2g); the sweeper evicts that door’s oldest runs first when its store exceeds it. |
CENDOR_MONITOR_ALLOW_DELETE_LIBS / _SDK | false each | Per door. Opt-in in-UI delete buttons for that door, backed by env-gated POST endpoints. Off ⇒ the read API stays GET-only. Opting one door in never opens the other. |
CENDOR_MONITOR_THEME_LIBS / _SDK | dark each | Per door. That door’s default theme (dark|light); a ?theme= query or the viewer’s saved toggle always overrides. |
CENDOR_MONITOR_FORWARD_ENDPOINT | (unset) | Container-level. Gateway mode: the collector additionally relays all OTLP onward — the same image doubles as a prod gateway in front of your own backend. It runs before the ingest assigns a door, so it is not a per-door setting. |
CENDOR_MONITOR_FORWARD_CONTENT | false | Container-level. When forwarding, whether to include content attributes. Default strips them — content stays in your store only. |
CENDOR_MONITOR_BASIC_AUTH | (unset) | Container-level. Optional user:password — HTTP basic auth over the whole UI + API. One credential per container. No auth by default (localhost dev tool — do not expose publicly). |
CENDOR_MONITOR_THEME | dark | Container-level. Theme of the door-less pages (the landing and the Container page). |
Ports: 3000 = the monitor + /api/cendor/ (same origin via nginx); 4317 = OTLP/gRPC ingest;
4318 = OTLP/HTTP ingest. The monitor always listens on 3000 inside the container — remap the host
port with -p 8080:3000. The read API is GET-only; delete-by-run/session runs ingest-side (plus
the retention sweeper).
How it works
%%{init: {"flowchart": {"htmlLabels": false}} }%%
graph LR
    APP["your app<br/>(OTEL_EXPORTER_OTLP_ENDPOINT)"]
    COL["OTel Collector<br/>:4317 / :4318"]
    ING["Cendor ingest<br/>(Node, Apache-2.0)"]
    STORE["store<br/>SQLite (default) | your Postgres"]
    CON["Cendor Monitor<br/>:3000 · GET-only /api/cendor/"]
    FWD["gateway forward<br/>(content stripped by default)"]
    BACKEND["your own backend<br/>(optional)"]
    FILE["audit.jsonl<br/>on your app host = evidence"]

    APP -->|standard OTLP| COL
    COL --> ING --> STORE --> CON
    COL -.->|"if FORWARD_ENDPOINT set"| FWD --> BACKEND
    APP -.->|"acttrace file, separate path"| FILE

    classDef ev fill:#2563EB,color:#fff,stroke:#1D4ED8;
    class CON ev;
Everything runs where you run the container. The tamper-evident audit file is a separate, offline-verifiable path — it does not flow through the monitor (see Honest limits).
Plugs into the stack
Cendor Monitor consumes the exact wire the libraries and SDK already emit — the same
Observability emitters (live_spans/span_tree, OTelSink, OTelMirror) and
the same gen_ai.* GenAI semantic conventions. Because it is standards-native, the same opted-in
wire renders in Langfuse or Braintrust too — nothing here is Cendor-proprietary. Each library’s data
shows up on its proof page: tokenguard budgets and spend, guardrails decisions, acttrace’s mirrored
governance, squeeze’s compression events, cassette’s replayed steps, contextkit’s assemblies, and
core’s call spans. See each library’s page for what it emits — e.g.
tokenguard and
acttrace.
Operate it
Cendor Monitor is production-quality engineering in one self-hosted container — but it is dev/team tooling on your infrastructure, not a hosted service. The essentials (the full operations runbook ships inside the image, and is summarised at cendor.ai/monitor):
- Backup/restore — SQLite: stop →
tarthe/datavolume (WAL is checkpointed on a clean stop); Postgres:pg_dump/pg_restoreon the database you own. - Upgrade —
docker pullthe new tag and re-run reusing the same volume; the schema upgrades in place (aschema_versionrow; additive migrations; zero data loss, tested on both backends). - Exposing it beyond localhost — do all three: set
CENDOR_MONITOR_BASIC_AUTH, front it with TLS (a reverse proxy — Caddy/nginx/Traefik), and add SSO via forward-auth (oauth2-proxy / Cloudflare Access / Authelia — no monitor-side code). The OTLP ports (4317/4318) have no auth, ever — keep them on a private network your apps share; never publish them to the internet. - Retention — per door:
CENDOR_MONITOR_RETENTION_{LIBS,SDK}(metadata) + the optional shorterCENDOR_MONITOR_RETENTION_CONTENT_{LIBS,SDK}(that door’s content dropped sooner). Each door’s Settings page previews its own next sweep. - Scale envelope — designed for dev/team scale and measured to 100k runs / 500k steps
(~125–162 MiB): the paginated runs list + content search stay interactive (single-digit-to-~20 ms);
whole-fleet all-time aggregates land ~0.5–1.5 s (windowed queries are far faster; a live store under
retention is much smaller). Full numbers in the repo’s
review/perf-v05.md. - Supply chain — each tagged build runs a Trivy scan (fails on fixable CRITICAL) and ships an SBOM
(syft, SPDX JSON); a weekly rebuild refreshes
:latestagainst upstream CVE fixes.
Honest limits
- Optional dev tooling, not the product. No Cendor library depends on it; the libraries and SDK run fully offline without it. Your own OTel backend (Azure Monitor / CloudWatch / Datadog / any OTLP) stays the documented production default.
- Never a hosted service. Cendor never operates a telemetry endpoint. The container runs on your infrastructure; data lives on your volume or in your Postgres, and you delete it on your own retention schedule.
- The monitor is an operational copy — not the evidence.
verify()runs on the hash-chained audit file on your app host, never on what the monitor shows. The monitor has no “verified ✓” claim and makes no compliance guarantee; treat it as monitoring, treat the file (or a signedexport()pack) as the record. See acttrace Honest limits. - Content is opt-in and off by default. The monitor never enables content capture; without it, runs render metadata-only. When on, content lands only where your OTLP goes.
- Dev-tool scale. SQLite by default suits a single builder’s dev loop; point
CENDOR_MONITOR_DB_{LIBS,SDK}at your own Postgres for a shared team deploy. No auth by default — setCENDOR_MONITOR_BASIC_AUTHand don’t expose it publicly. - Licensing — a permissive aggregate, no AGPL/GPL. See Licensing below.
Licensing
The image is a permissive aggregate: Apache-2.0 (code) with OFL-1.1 fonts. Every part is under a permissive license — no AGPL/GPL anywhere, so running the container triggers no copyleft or source-disclosure obligation (the kind a legal/security review usually screens for).
| Component | License | Notes |
|---|---|---|
| Cendor’s monitor UI, ingest service, and collector configs (the parts Cendor wrote) | Apache-2.0 | Use / modify / redistribute / commercial; keep the NOTICE, state changes; includes a patent grant. |
| OpenTelemetry Collector (bundled binary — the OTLP front door) | Apache-2.0 | Same permissive terms; keep its notice. |
| Node.js (runs the ingest service) | MIT | Permissive, minimal — keep the copyright line. |
nginx (the :3000 front door) | BSD-2-Clause | Permissive, minimal — keep the copyright line. |
| Manrope + JetBrains Mono (vendored fonts) | SIL OFL-1.1 | Permissive for bundling. Two caveats: the fonts may not be sold on their own, and a modified font must be renamed (Reserved Font Name). This is why the aggregate isn’t “pure Apache-2.0”. |
Obligations are light — keep the bundled notices, shipped in the image at /licenses (with the
OFL font texts under /licenses/fonts). Nothing here forces you to disclose your own source.
Trademarks belong to their owners: bundling OpenTelemetry / Node.js / nginx / JetBrains software
under their OSS copyright licenses grants no trademark rights (names, logos), and implies no
endorsement.
The license of the image (Apache-2.0 + OFL) is independent of where the source is hosted — “Apache-2.0 (code)” describes the code’s terms, not its public availability.